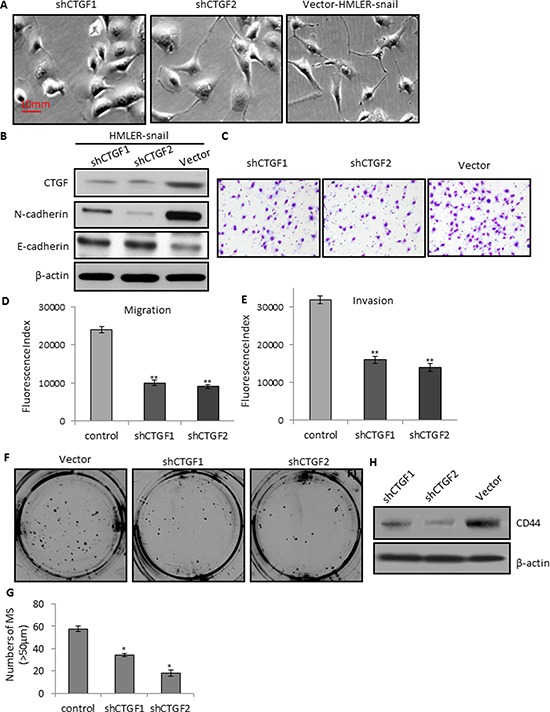
Figure 5. CTGF depletion reduces tumor cell migration, invasion, and mammosphere formation via MET.

A. Representative phase-contrast images showing the epithelial morphology of the shCTGFs knockdown cells. B. Western blot analysis of the CTGF and N-cadherin, E-cadherin in the control and shCTGFs cells. C–D. Quantitative graphs and representative membrane images showing the migration ability of the control and shCTGFs cells measured by the Boyden Chamber assay. E. Quantitative graphs showing the invasion ability of the control and shCTGFs cells measured by coating Matrigel in the Boyden Chamber assay. F–G. CTGF depletion in the HMLER-snail cells reduced the number and size of mammospheres. H. Western blot analysis of CD44 in the mammospheres. *P < 0.05, vs control; **P < 0.01, vs control. P values were determined by student t-test.
