
Figure 5. Immunofluorescent staining and digital analysis of CD248 expression levels and other markers on tumor microvessels.
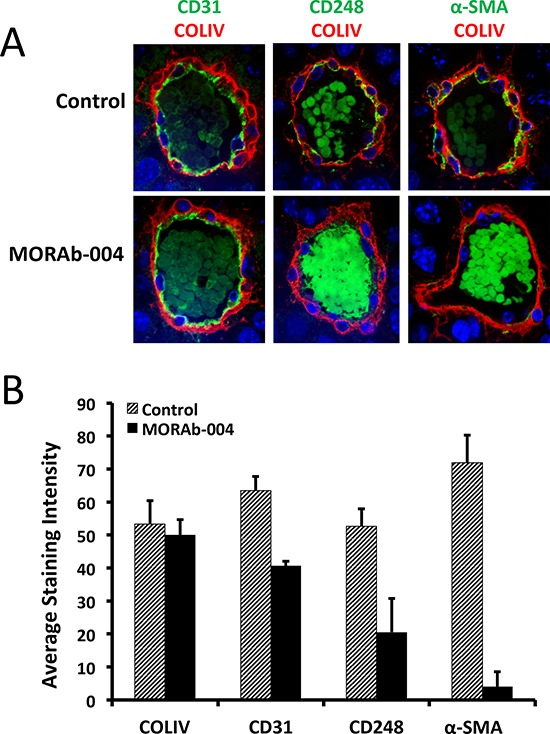
A. IF images of B16-F10 tumor microvessels stained with CD31, CD248, and α-SMA (green), co-stained with ColIV (red). All images were captured at 60X using Olympus IX81confocal microscope; B. Comparison of relative expression levels of IF staining of markers on monoclonal isotype control and MORAb-004 treated microvessels.