
Figure 2. Kinetics of ADO production by melanoma cell lines.
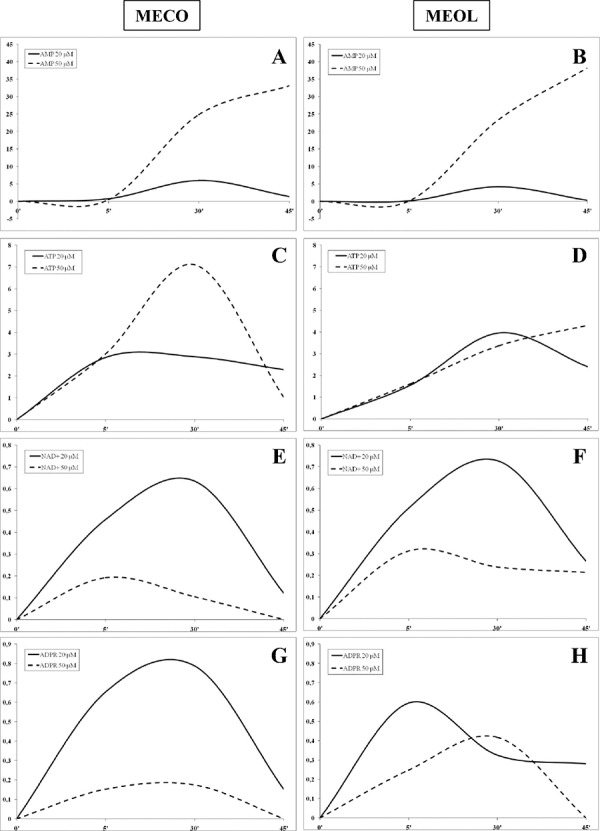
ADO production was investigated in supernatants collected at 5, 30 and 45 min from MECO (panel A-C-E-G) and MEOL (panel B-D-F-H) cell lines treated with AMP (panel A-B), ATP (panel C-D), NAD+ (panel E-F) and ADPR (panel G-H) 20 (continuous lines) or 50 (dotted lines) μM. Data are expressed as nmol ADO.