
Figure 3. NOP14 silencing increases tumorigenicity and metastasis.
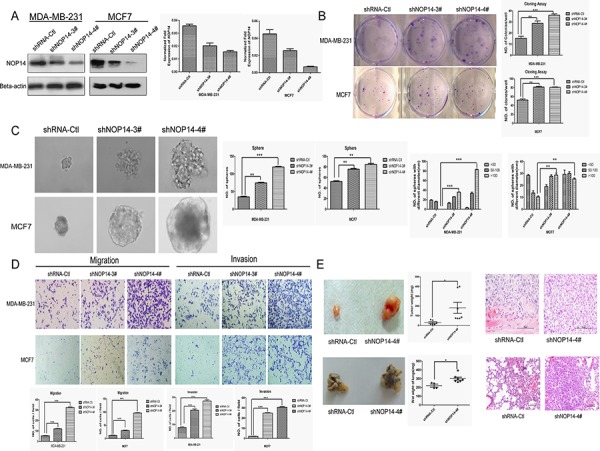
A. Two shRNAs (shNOP14–3# and shNOP14–4#) directed against NOP14 effectively decreased NOP14 expression as detected by qPCR and western blot. Scrambled shRNA Control (shRNA-Ctl) and β-actin were used as controls. B. Representative images of increased foci formation in plate cultures. Quantitative analysis of foci numbers are shown in the right panel. Values are reflected as the mean ± 3SD of at least three independent experiments. C. Representative images of the increased sphere-forming ability of NOP14-silenced cells. The results are summarized as the mean ± 3SD of three independent experiments in the right panel. D. Transwell migration and invasion assays for which the results are summarized as the mean ± 3SD of three independent experiments as shown in the lower panel. E. Representative images of increased tumor formation in nude mice (upper), lung metastasis (lower), wet weight and HE staining shown in the right panel. (*P < 0.05, **P < 0.01, ***P < 0.001, independent Student's t test).