
Figure 4. Analysis of Copy Number Variations (CNVs) in FF and FFPE tumor pairs.
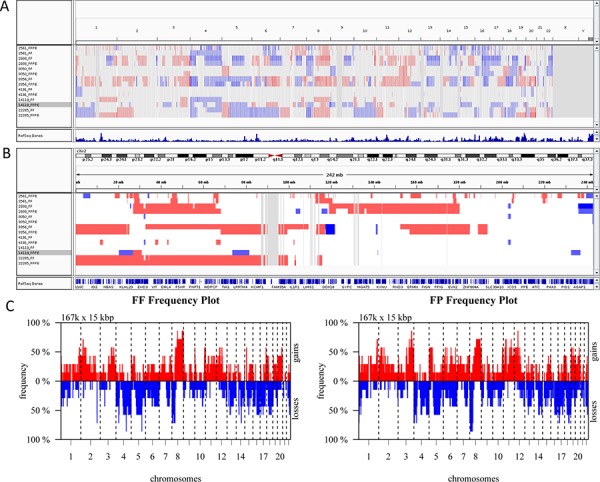
Copy number variations in tumor samples were determined using QDNAseq and visualized by Integrative Genome Viewer. A. Whole genome view with copy number loss (blue) and copy number gain (red) regions are highlighted for all 7 pairs of tumor samples. B. Copy number variations in Chromosome 2 are shown for all 7 pairs of FF and FFPE samples. C. Copy number profiles of FF and FFPE (FP) tumor groups show similar pattern of gains and losses. Frequency of copy number alterations are plotted on Y-axis, and chromosome coordinates are plotted on X-axis and include chromosome 1 to 22. Plot was generated using CGHbase R package.