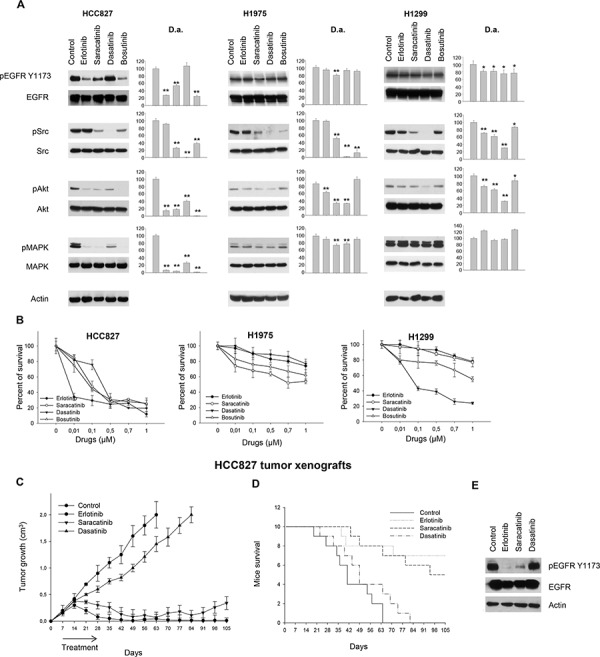
Figure 2. Effects of Src inhibitors on signal transduction and survival of human NSCLC cell lines sensitive or resistant to erlotinib.

A. Western blot analysis of protein extracts from HCC827, H1975 and H1299 cells treated for 3 hours with erlotinib, saracatinib, dasatinib or bosutinib (1 μM). Densitometric analysis (D.a.): The relative optical density of phospho-protein levels normalized to total protein levels is shown as histograms. *, 2-sided P < 0.05 versus control; **, 2-sided P < 0.01 versus control. B. Percent of survival of HCC827, H1975 and H1299 cells treated for 72 hours with erlotinib, saracatinib, dasatinib or bosutinib (1 μM), as measured by MTT assay. Data represent the mean (± SD) of three independent experiments, each performed in triplicate. Bars, SDs. C. After 7 days following subcutaneous injection of HCC827 cells, mice were randomized (10/group) to receive erlotinib, saracatinib or dasatinib, as described in the Methods section. The one-way ANOVA test was used to compare tumor sizes among treatment groups at the median survival time of the control group (42 days). Results are statistically significant for all the drugs vs control (P < 0.0001). Bars, SDs. D. Median survival was not statistically significant for dasatinib versus control (log-rank test); mouse groups treated with erlotinib or saracatinib did not reach a median survival, since 70% and 50% of animals were still alive at the end of the experiment, respectively. E. Western blot analysis was performed on total lysates from tumor specimens of two mice sacrificed on day 14. Tumors derived from each treatment group were pooled during lysis to obtain a single specimen.
