
Figure 4. Heatmap of the 28 differentially expressed genes identified at q-value = 0 by SAM two-class analysis of 102 MM patients stratified based on the presence of DIS3 mutations.
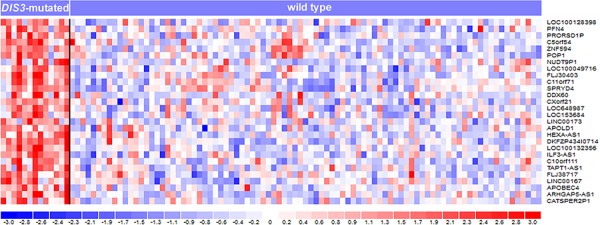
In the heatmap, the color-scale bar represents the relative gene expression changes normalized by the standard deviation, and the color changes in each row represent gene expression level relative to the mean across the samples.