
Figure 2. Characterization of dendriplexes and h-R3-dendriplexes.
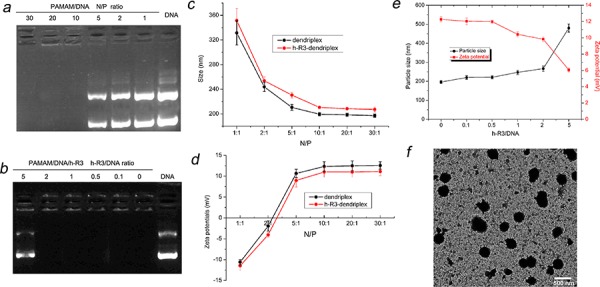
a. Agarose gel retardation assay of dendriplexes at different N/P ratio (1, 2, 5, 10, 20, 30) b. Agarose gel retardation assay of h-R3-dendriplexes at different h-R3/DNA ratio (0, 0.1, 0.5, 1, 2, 5) at N/P of 20. c. Particle Sizes of dendriplexes and h-R3-dendriplexes at different N/P ratio. Results were expressed as mean ± standard deviation (n = 3). d. Zeta potentials of dendriplexes and h-R3-dendriplexes at different N/P ratio. Results were expressed as mean ± standard deviation (n = 3). e. Effect of h-R3 on the particle sizes and zeta potentials of h-R3-dendriplexes (N/P 20:1). f. TEM image of h-R3-dendriplexes (N/P 20:1 h-R3/DNA 1:1). Scale bar is 500 nm.