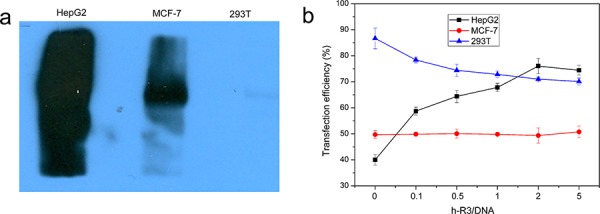
Figure 3. Different cell lines and Transfection efficiency.

a. Assessment of EGFR expression in different cell lines, including EGFR-overexpressing HepG2, EGFR-expressing MCF-7 and EGFR-negative 293T was determined by Western blotting. b. Transfection efficiency of h-R3-dendriplex with N/P 20:1, different h-R3/DNA (0, 0.1, 0.5, 1, 2 and 5) in HepG2, MCF-7 and 293T quantitatively by flow cytometer. Transfection was performed at a dose of 1 μg/well of pEGFP. Results were expressed as mean ± standard deviation (n = 3).
