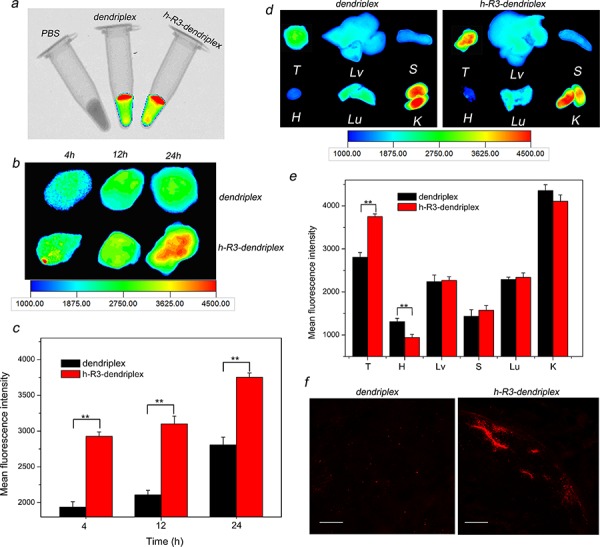
Figure 6. Ex vivo distribution and gene delivery of dendriplexes and h-R3-dendriplexes.

a. Overlay images of X-ray and fluorescence imaging of three samples in vitro. b. Ex vivo fluorescence imaging of the tumor at 4 h, 12 h and 24 h after i.v. injection to HepG2 tumor-bearing nude mice. c. Region-of-interest analysis of fluorescent signals from the tumors 4 h, 12 h and 24 h after i.v. injection to mice. Error bars indicate s.d. (n = 3). **P < 0.01. d. Ex vivo fluorescence imaging of five major organs and tumor 24 h post-injection (T, tumor; H, heart; Lv, liver; S, spleen; Lu, lung; K, kidney). e. Region-of-interest analysis of fluorescent signals from the tumors and normal organs. (T, tumor; H, heart; Lv, liver; S, spleen; Lu, lung; K, kidney). Error bars indicate s.d. (n = 3). ***P < 0.01. f. Ex vivo distribution of gene expression in the tumor 24 h after i.v. injection to nude mice-bearing HepG2 tumor. Frozen tumor sections (6 um thick) were examined by CLSM. Red homogeneous spots present the Cy5-dendriplexes and Cy5-h-R3-dendriplexes. Scale bars = 100 μm.
