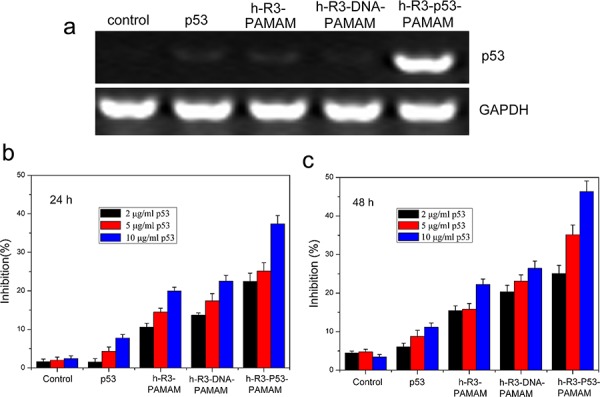
Figure 7. H-R3-dendriplexes for p53 delivery.

a. Expression of p53 at mRNA after transfection with different samples (naked p53, h-R3-PAMAM, h-R3-DNA-PAMAM and h-R3-p53-PAMAM) in HepG2 cells by RT-PCR; b. Cell growth inhibition induced by different p53 concentration treated after 24 h (2 μg/ml, 5 μg/ml, 10 μg/ml). N/P 20:1, h-R3/p53 1:1. Results were expressed as mean ± standard deviation (n = 3). c. Cell growth inhibition induced by different p53 concentration treated after 48 h (2 μg/ml, 5 μg/ml, 10 μg/ml). N/P 20:1, h-R3/p53 1:1. Results were expressed as mean ± standard deviation (n = 3).
