
Figure 1. Expression of the 20 selected genes in NSC and GSC cultures measured by microarrays (A-B) and qPCR (C-C’).
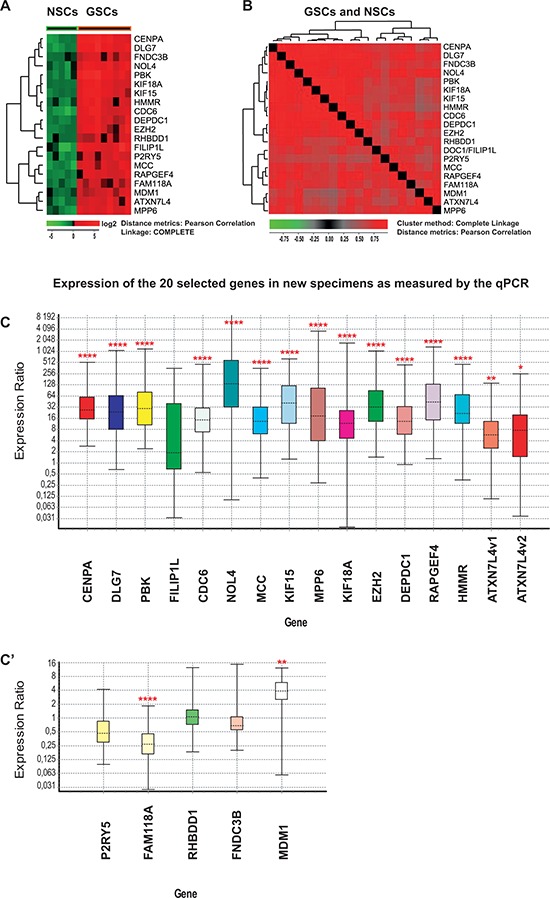
A. Hierarchical clustering of the 20 selected genes in NSC (green) and GSC cultures (red) using Pearson correlation as a distance metric. Gene expression was analyzed in 14 primary cell cultures from newly harvested specimens (nine GSC cultures and five NSC cultures). Red corresponds to higher gene expression levels. B. Hierarchical clustering with distance matrix using Pearson correlation as a distance measure was calculated for the same set of data as in A. Red corresponds to higher correlation levels. All fields are red thus indicating that the expression levels of the 20 selected genes are highly correlated in all 14 cultures. C-C’. Expression of the 20 selected genes in an independent set of samples measured by qPCR. Four NSC and seven GSC primary cultures were prepared from biopsies of newly harvested tissues. All genes were significantly up-regulated in GSC cultures with the exception of FILIP1L, P2RY5, RHBDD1 and FNDC3B. FAM118A was significantly down-regulated. The two isoforms of ATXN7L4 are indicated as ATXN7L4v1 and ATXN7L4v2. Expression values in GSCs were calculated using multiple controls (values obtained for all tested NSCs and NFCs) as reference. Fold change values and statistical parameters can be found in Table 1 and Supplementary Table S1. The bottom and top of each box indicate the 25th and 75th percentile (the lower and upper quartiles, respectively), and the band near the middle of the box represents the 50th percentile (the median). The ends of the whiskers represent the minima and maxima of all the data. For data analysis and the preparation of this figure we used the Pfaffl et al., 2002 algorithm utilized in REST software [61]. Asterisks correspond to p values and indicate level of significance: * = (p ≈ 0.01–0.05), ** = (p ≈ 0.001–0.01) and **** =(p < 0.0001).