
Figure 5. Expression of the proteins encoded by the 20 selected genes and targeted proteomics.
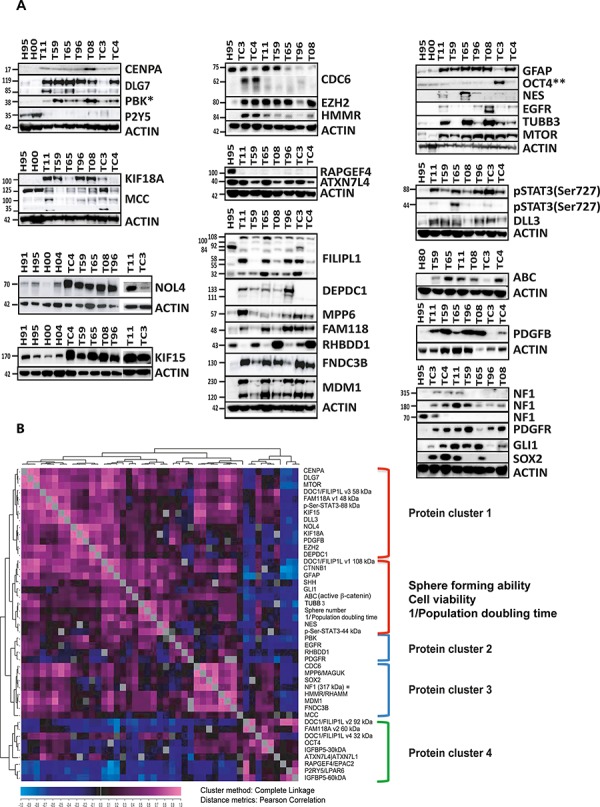
A. Western blot showed that 15 genes were significantly up-regulated at the protein level in all tested GSC cultures, including CENPA, DLG7, PBK, FILIPL1, DEPDC1, NOL4, CDC6, KIF15, MPP6, KIF18A, EZH2, HMMR, FAM118A, FNDC3B and MDM1. RHBDD1 was up-regulated at the protein level in some of the GSC cultures while MCC and RAPGEF4 were clearly down-regulated at the protein level even though their RNA expression levels were significantly higher in GSCs. This analysis was performed in two to four NSC (not all shown) and seven GSC cultures. The observed sizes in kDa are indicated. The expected protein sizes, quantification of the observed bands and additional information can be found in Table 1 and Supplementary Figure S7. *This western blot was included in another manuscript [56]. **This western blot was previously published in [22]. B. Results of targeted proteomics. Quantified western data were used for hierarchical clustering with a distance matrix in order to determine the level of co-expression. Each square in the chart represents the Pearson's correlation between the expression levels of two proteins (pink representing the highest and dark blue the lowest correlation). Reporters of the known signaling pathways and proteins relevant for sub-classification of GBM at the protein level [26] were also included (western images of the reporters are shown in A, panel to the right). In addition to the western data, the results of the functional assays were quantified and added to the protein dataset. The sphere forming assay and PDT values are presented as normalized values (0–1, 1 being the highest sphere forming ability, 0 being the number of spheres in NSCs) and reciprocal values (1/n), respectively. The nine proteins (corresponding to the nine genes in gene cluster I) are indicated in yellow.