
Figure 7. Results of Immunolabeling.
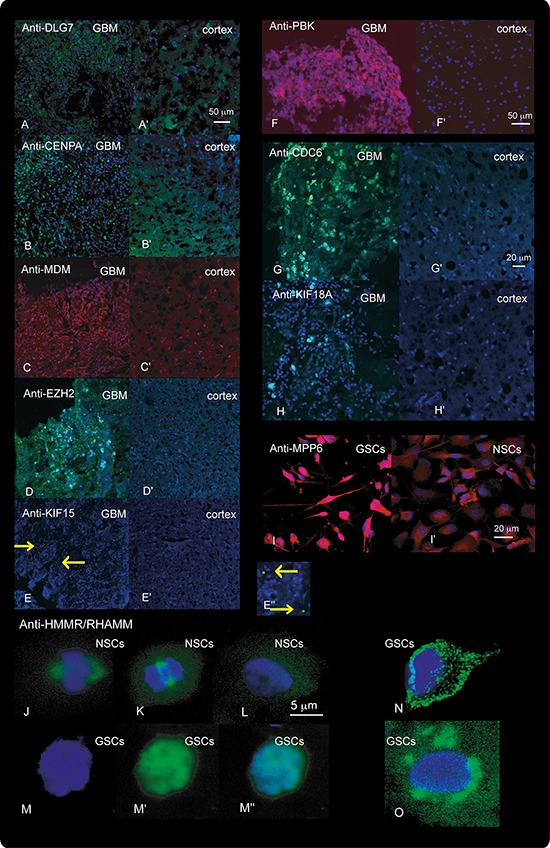
Immunolabeling with antibodies against DLG7, CENPA, MDM, EZH2, KIF15, PBK, CDC6 and KIF18A in the cerebral cortex (A’–H’) and in GBM tissues A–H. and against MPP6 and HMMR in NSCs (I’, J–L. and GSCs I, M–O. is shown. Tissues immunolabeled with anti-DLG7 (A-A’), anti-CENPA (B-B’), anti-EZH (D-D’), anti-KIF15 (E-E”), anti-CDC6 (G-G’), anti-KIF18A (H-H’), and HMMR (J–O) were visualized with green fluorescence. Tissues and cells immunolabeled with Anti-MDM1 (C-C’), anti-PBK (F-F’) and anti-MPP6 (I-I’) were visualized with red fluorescence. DAPI staining of the nuclei is visualized as blue fluorescence. E”, Enlargement of a section from e showing the KIF15 signal (arrowheads) in GSCs. In NSCs the HMMR protein was located in centromeres during mitosis (J and K) and diffusely spread through the cytoplasm during interphase (L). In GBM HMMR was both up-regulated and showed aberrant distribution in the cells (M–O). In these cells, HMMR was detected in the cytoplasm (N), around the nucleus (O) and in the nucleus, where its expression overlapped with DAPI (M-M”). M, nuclear staining (blue). M‘ Anti-HMMR staining (green). Overlap between the two (J, M”, N and O).