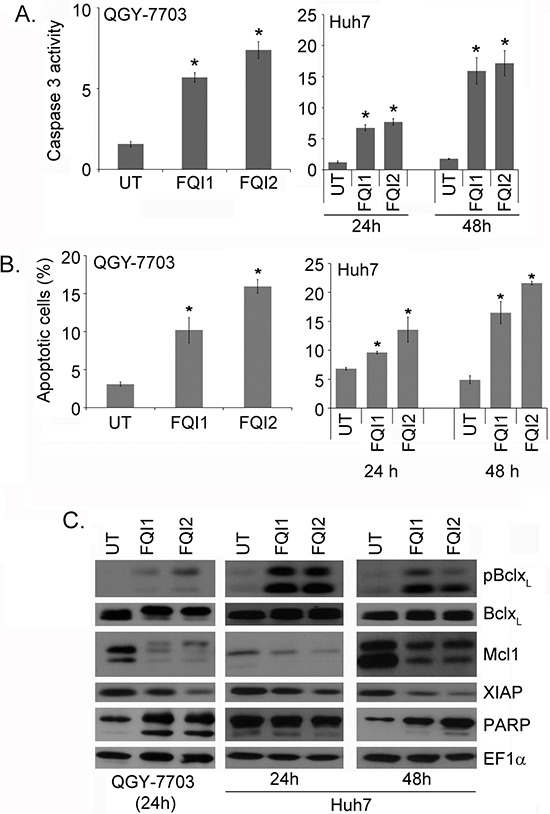
Figure 7. LSF inhibitors induce apoptosis.

A. Caspase 3 activity (mM of AMC released/mg protein/30 min) was measured in the indicated cells upon treatment with 2 μM FQI1 or FQI2. QGY-7703 cells were treated for 24 h. The data represent mean ± SEM. *:p < 0.01. B. Apoptosis was measured by Annexin V staining followed by flow cytometry in the indicated cells upon treatment with 2 μM FQI1 or FQI2. QGY-7703 cells were treated for 24 h. The data represent mean ± SEM. *:p < 0.01. C. Western blot analysis of the indicated proteins in the indicated cells upon treatment with FQI1 or FQI2 for the indicated periods of time.
