
Figure 2. The 9p24 amplicon in a triple negative breast cancer genome.
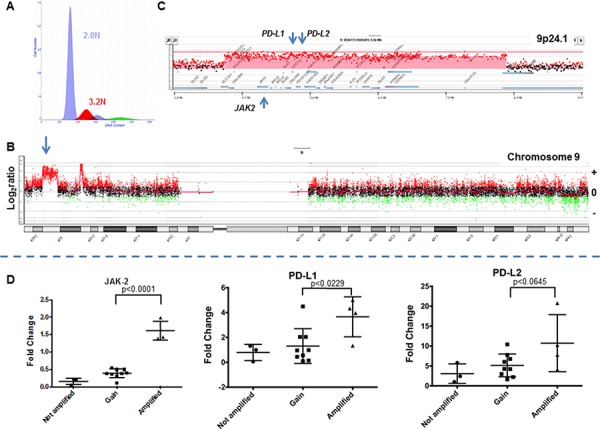
A. Flow histogram of sorted 3.2N TNBC population from FFPE tissue. B. Chromosome 9 CGH plot and detection of 9p24 amplicon. C. Gene specific view of amplicon. Red shaded area denotes ADM2 defined copy number aberrant region. D. Gene expression of JAK2, PD-L1, and PD-L2 in TNBC. Comparisons and correlations between the expression levels of PD-L1, PD-L2, and JAK2 genes and copy number status of chromosome 9p24.1 were performed using an unpaired t test and variation among and between groups were calculated using an ANOVA test (GraphPad Prism 6).