
Figure 1. SAHA-induced survivin downregulation by p53 activation.
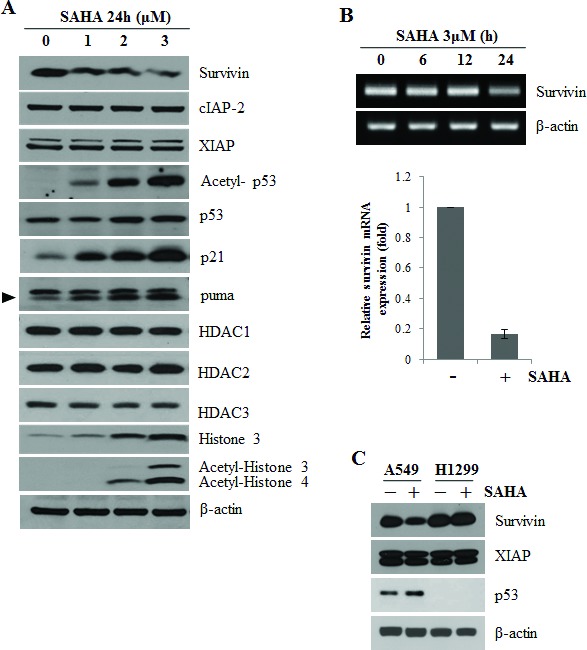
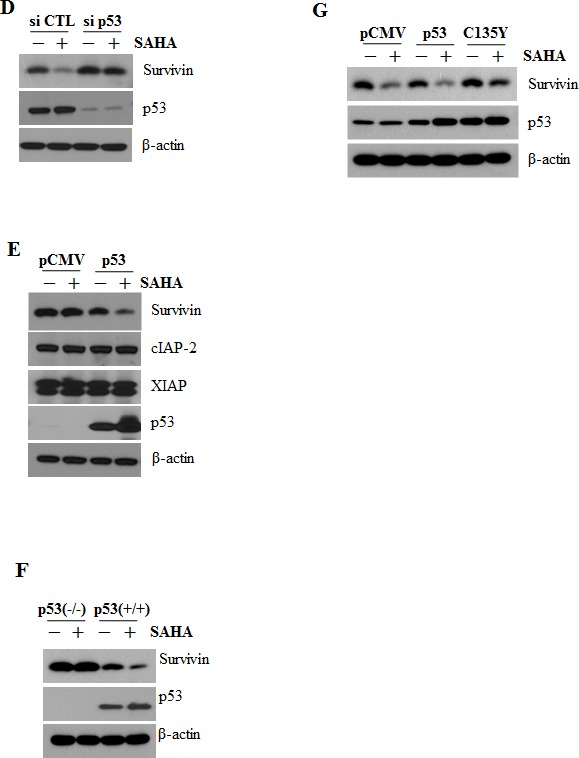
After incubation, cells were lysed and analyzed by Western blotting and RT-PCR as described in Materials and Methods. β-actin was used as a control for equal protein and cDNA loading. In qPCR, Survivin mRNA expression levels were determined by the relative to the control groups using 2−ΔΔCt method. Values were represented as means ± SD of three independent experiments. Immunoblots and PCR bands are representative of at least three independent experiments. A. A549 cells were treated with 0–3 μM SAHA for 24 h. B. A549 cells were treated with 3 μM SAHA for various times (RT-PCR) or for 24 h (qPCR). C. A549 and H1299 cells were treated with 2 μM SAHA for 24 h. D. A549 cells were transfected with 50 nM p53 siRNA (si p53) or negative control siRNA (si CTL) and were treated with 2 μM SAHA (+) for 24 h. E. H1299 cells were transfected with 0.1 μg p53 wild-type expression plasmid (p53) or empty vector (pCMV) using Lipofectamine and treated with 2 μM SAHA for 24 h. The specificity of p53 interference or overexpression was confirmed using an anti-p53 antibody. F. HCT 116 colon cancer cell lines, p53(−/−) and p53(+/+) were treated with 2 μM SAHA (+) for 24 h. G. A549 cells were transfected with 0.1 μg p53 wild-type expression plasmid (p53), p53 dominant negative expression plasmid (C135Y, 135C to Y mutation) or empty vector (pCMV) and treated with 2 μM SAHA for 24 h.