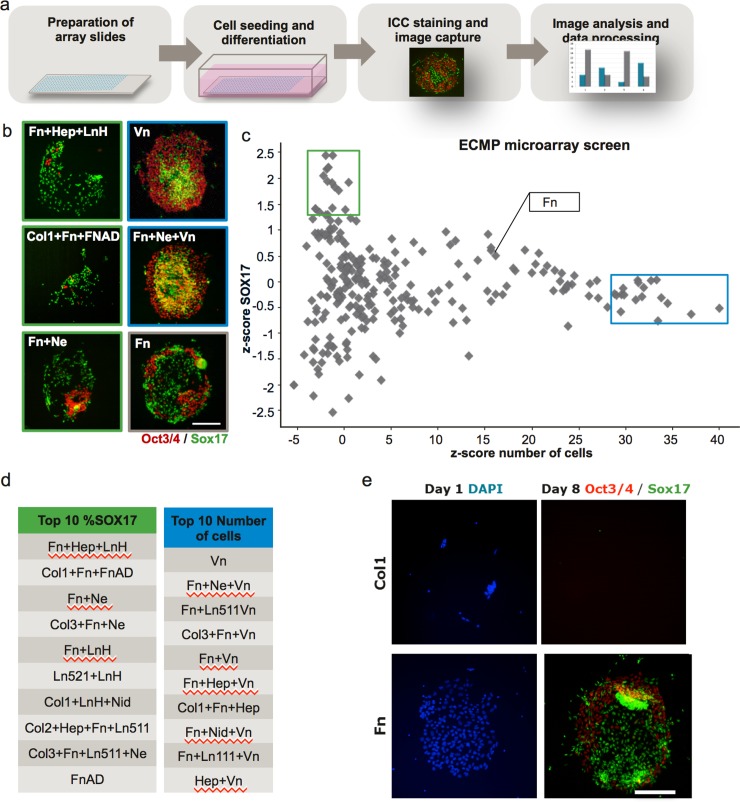
Fig 1. The microarray screen with combinations of ECMPs demonstrated that the DE differentiation was affected by the ECMPs.
(a) Schematic overview of the ECMP microarray screen. The ECMP microarray slides were prepared by inkjet spotting and undifferentiated hES cells were subsequently seeded and differentiated towards DE. To assess the differentiation, the samples for immunofluorescence were stained for the markers Oct3/4 (undifferentiated hES cells), Sox17 (DE) and DNA (DAPI), and microscope images were captured using an automated microscope, InCell Analyzer. The images were quantified and the data was analysed. (b) Fluorescence microscope images of selected spots stained for Oct3/4 (red) and Sox17 (green) (scale bar = 200μm). (c) Sox17 z-scores plotted against cell number z-scores for each respective ECMP combination (n = 4). The green square indicate the ECMP combinations giving highest fraction of DE cells, whereas the blue square represents the ECMP combinations giving highest cell number. (d) Tables of the ECMP combinations giving to the 10 highest fractions of Sox17 positive cells and top 10 highest cell count respectively. (e) Immunofluorescence staining of spots from the protein microarray screen. Images were captured at day 1 (one day after seeding) and day 8 (at the end of the DE differentiation protocol) (Scale bar = 200μm).

