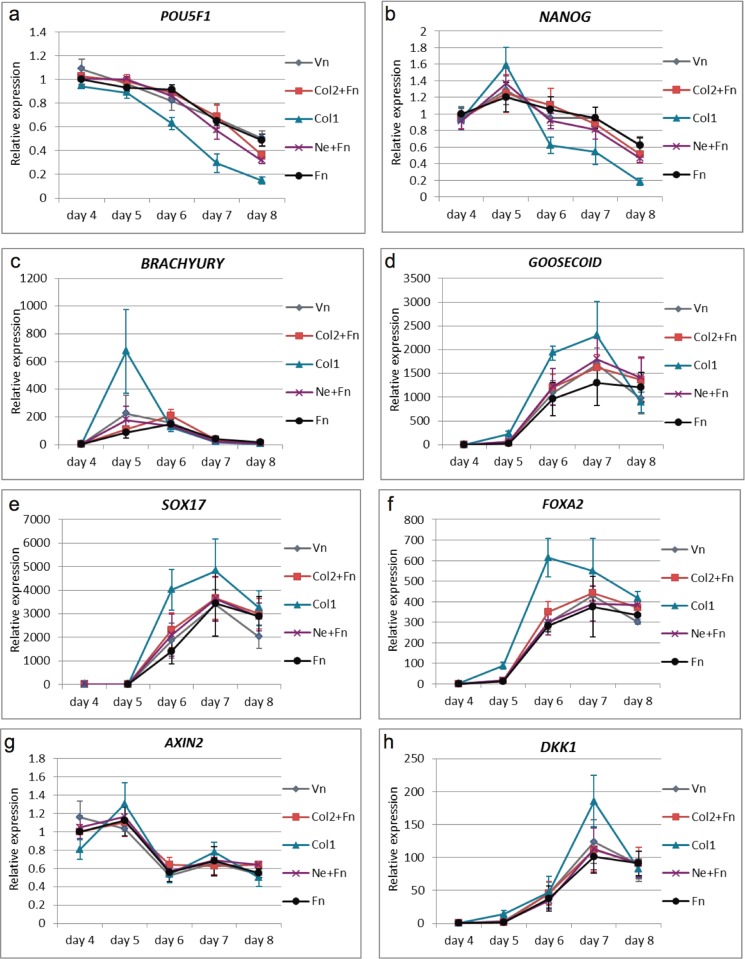
Fig 5. Gene expression analysis for markers at different time points during DE differentiation.
Following genes were analysed; the pluripotent markers POU5F1 (a) and NANOG (b); mesendoderm/early DE marker BRACHUYRY (c); the DE markers GOOSECIOD (d), SOX17 (e), FOXA2 (f); the WNT downstream target AXIN2 (g); and the WNT inhibitor DKK1. (n = 3, mean ± S.E.M.). Abbreviations are explained in legend Fig 3.

