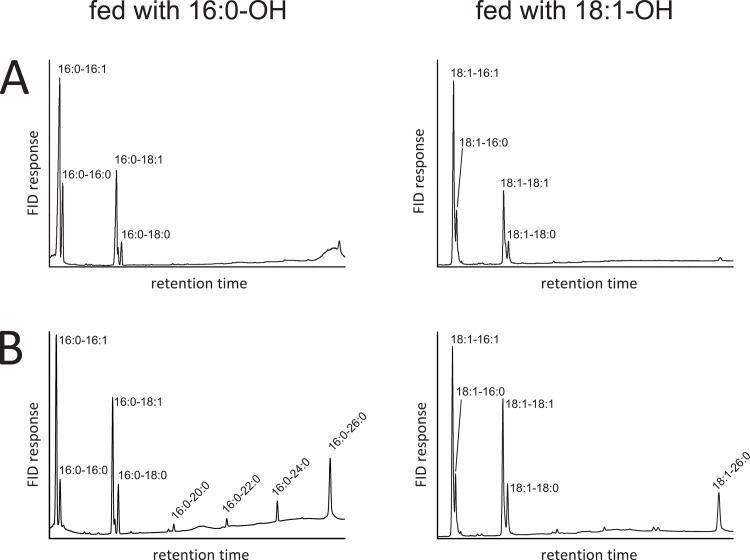
Fig 4. Comparison of WEs derived from yeast cultures expressing AWAT2 or V2.
A. GC analysis of WEs derived from a culture expressing mouse AWAT2 either fed with 16:0-OH (left chromatogram) or 18:1-OH (right chromatogram). B. GC analysis of WEs derived from a culture expressing V2 either fed with 16:0-OH (left chromatogram) or 18:1-OH (right chromatogram). In comparison to AWAT2, V2 expressing cultures synthesize four additional WE upon feeding 16:0-OH (left chromatogram) and a single additional WE upon feeding 18:1-OH (right chromatogram). The results shown here for cultures expressing V2 are also representative for cultures expressing V5, mouse AWAT2 N36R as well as AWAT2 A25F N36R (not shown). Data are representative for at least three independent biological replicates.

