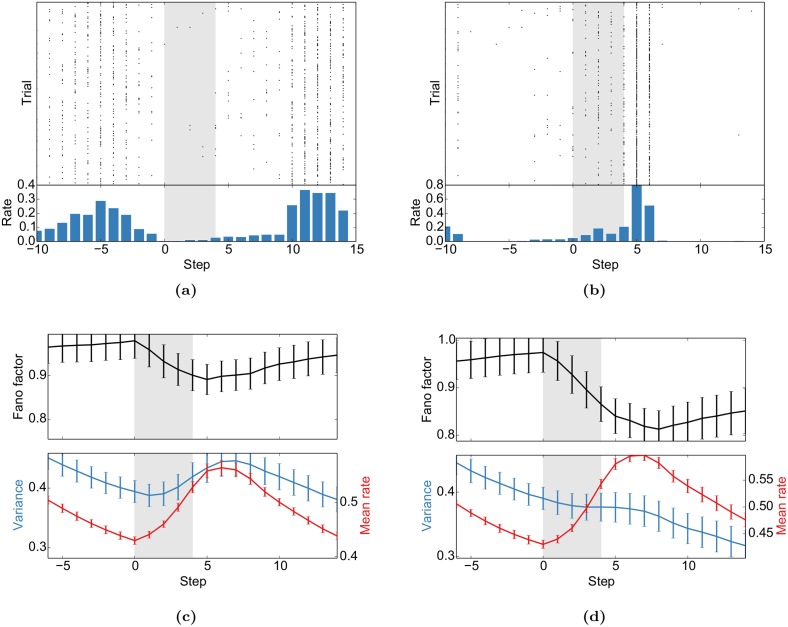
Fig 5. Stimulus onset quenches variability.
(a) and (b) Sample spike trains from two representative neurons aligned to the stimulus presentation (shaded area). (c) and (d) The population average of the Fano factor (FF) decreases with stimulus onset. The FF is only computed for units that do not receive direct sensory input. These results mimic Fig 5 of [10]. FFs, mean rates and variances are for causal moving windows of 5 time steps. (c) was computed for the presentation of stimulus “AXXX_ _ _ …” during the test phase after being presented with a probability of 0.1 during self-organization. (d) In turn, “BXXX_ _ _ …” had a probability of 0.9 in the same experiment. Error bars represent SEM over 20 independent realizations.

