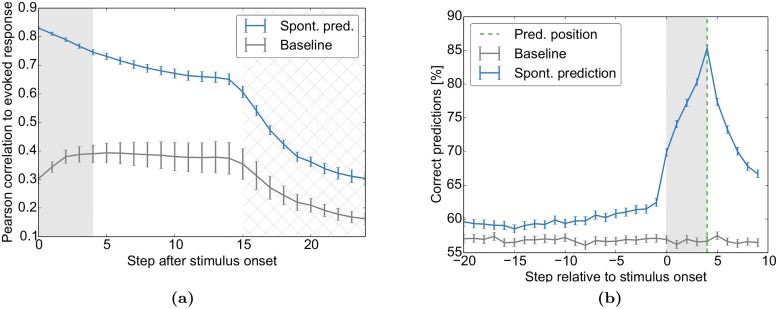
Fig 6. Spontaneous activity predicts evoked activity and decisions.
The network self-organizes during repeated presentations of the sequences “AXXX_ _ _ …” (33%) and “BXXX_ _ _ …” (67%) with blank intervals in between. In the test phase, an ambiguous mix of cue “A” and cue “B” is presented (“A/BXXX_ _ _ …”, shaded area) and the network decides at the first “_” with a linear classifier if either A or B was the start of the sequence. (a) Trial-to-trial variability of the evoked activity patterns during the test phase is well predicted from activity prior to stimulus onset. The figure shows the correlation between the variable evoked activity patterns at different time steps after stimulus onset and a linear prediction of these based on the stimulus and either the spontaneous activity state prior to stimulus onset (blue) or trial-shuffled spontaneous activity (baseline, grey). Similar to Fig 4 in [8], the decay of the correlation is exponential-like. The correlation drops further as new stimuli are presented (hatched area). Due to variable inter-trial-intervals, the hatched area covers the entire area were stimulation is possible. (b) The decisions of the network can be predicted from spontaneous activity before stimulus onset. The plot shows the accuracy of predicted network decisions (“A” vs. “B”) at the green dashed line from activity surrounding the decision. Separate classifiers were trained for each of the 11 ambiguity classes (e.g. 20%A) and time step surrounding the decision. The grey line corresponds to predictions from trial-shuffled activity. Predictions in (b) are averaged over all priors of Fig 7c. Error bars represent SEM over 20 independent realizations.

