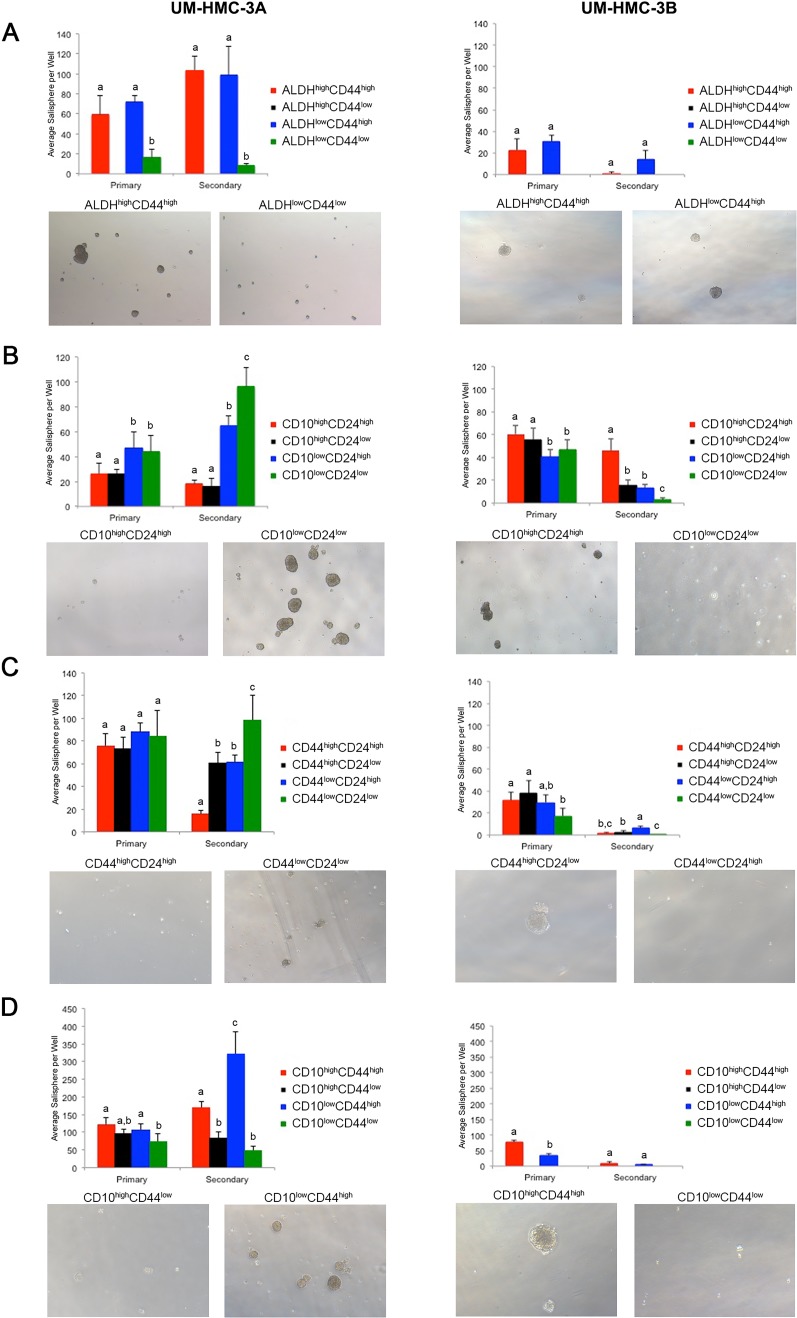
Figure 2. In vitro salisphere analysis of FACS-sorted mucoepidermoid carcinoma cell lines (UM-HMC-3A, UM-HMC-3B).
A.–D. Ultra-low attachment plates were seeded with 2,000 cells/well (6-well plates), and cells were cultured for seven days to generate primary salispheres. Then, salispheres were dissociated into single cell suspensions, seeded in new ultra-low attachment plates, and secondary salispheres were counted after additional seven days. A. Graph depicting the average number of salispheres per well of cell lines FACS-sorted for ALDH/CD44 (n = 4-6). B. Graph depicting the average number of salispheres per well of cell lines FACS-sorted for CD10/CD24 expression (n = 5-6). C. Graph depicting the average number of salispheres per well of cell lines FACS-sorted for CD44/CD24 cells (n = 6). D, Graph depicting the average number of salispheres per well of cell lines FACS-sorted for CD10/CD44 sorted cells (n = 5-6). All images were taken at 40X. Statistical analysis was performed using one-way ANOVA. Different low case letters indicate statistical difference at p < 0.05.

