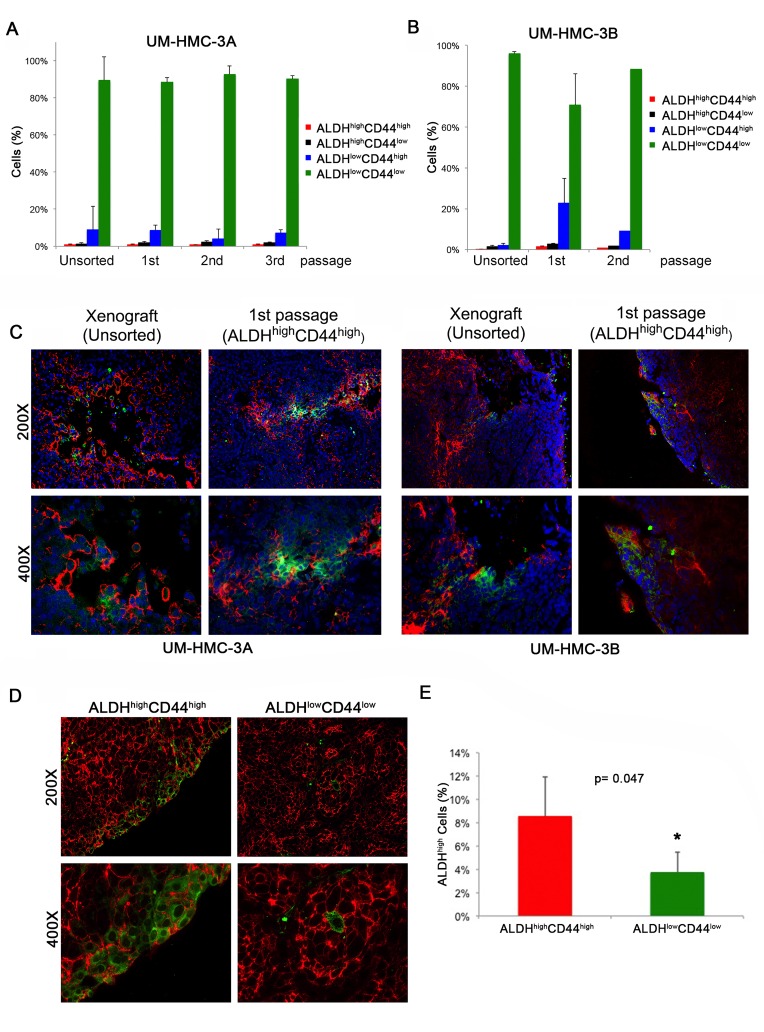
Figure 5. Characterization of xenograft tumors generated with cells sorted for ALDH/CD44.
A. Graph depicting the percentage of ALDH/CD44 cells in tumors generated with FACS-sorted UM-HMC-3A (passage 14) over three in vivo passages. B. Graph depicting the percentage of ALDH/CD44 staining cells in tumors generated with FACS-sorted UM-HMC-3B (passage 27) over two in vivo passages. C. Immunofluorescence staining of tumors generated from the original unsorted UM-HMC-3A (passage 14) and UM-HMC-3B (passage 27) xenograft cells compared to tumors generated from 400 ALDHhighCD44high cells sorted from the original xenografts. CD44 is stained in red while ALDH-1 is stained in green. D. Immunofluorescence staining of tumors generated with FACS-sorted ALDHhighCD44high or ALDHlowCD44low cells. CD44 is stained in red while ALDH-1 is stained in green. E. Graph depicting the percentage of ALDHhigh cells in tumors generated with cells FACS-sorted for ALDHhighCD44high or ALDHlowCD44low as determined by flow cytometry with Aldefluor.

