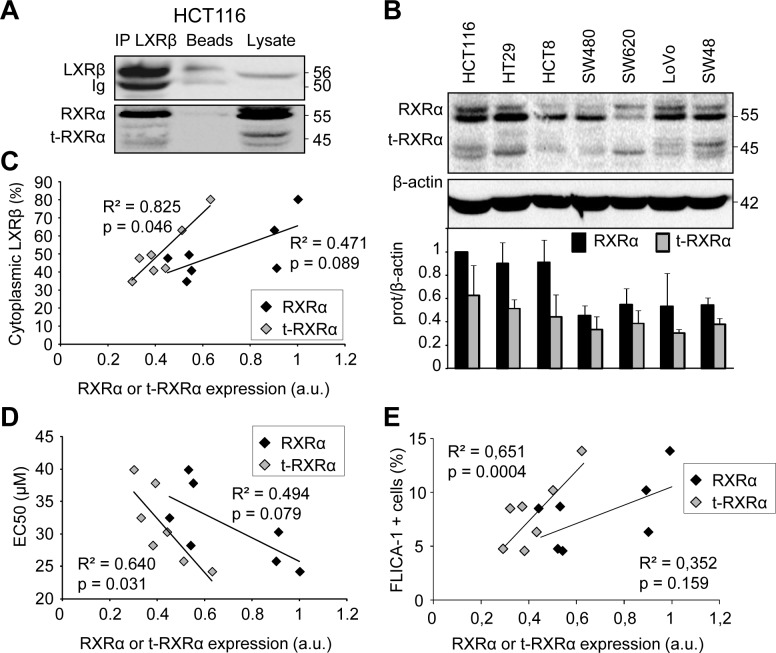
Figure 2. Human colon cancer cell sensitivity and LXRβ localization are correlated with t-RXRα expression.
A. Immunoprecipitation using LXRβ antibody on HCT116 cells and followed by western blot analysis using anti-LXRβ and anti-RXRα antibodies. Beads as negative controls without antibody for IP and total lysate were also loaded. Numbers indicate molecular masses in kilodaltons. One representative experiment out of three. B. Western blot analysis of RXRα protein expression in human colon cancer cell lines. β-Actin was used as a loading control. Numbers indicate molecular masses in kilodaltons. Upper panel: one representative experiment. Lower panel: mean quantification of the RXRα/β-actin (black) and the t-RXRα/β-actin (grey) ratios in three different experiments ± s.d.. Relationship between proportion of LXRβ in the cytoplasm (%) and relative expression of RXRα (black diamonds) or t-RXRα (grey diamonds) in human colon cancer cell lines. C. Relationship between EC50 (μM) and relative expression of RXRα (black diamonds) or t-RXRα (grey diamonds) in human colon cancer cell lines. D. Relationship between FLICA-1 positive cells and relative expression of RXRα (black diamonds) or t-RXRα (grey diamonds) in human colon cancer cell lines. E. Solid lines represent linear regression curves. The regression coefficient (R2) and the Pearson correlation (p) are given.

