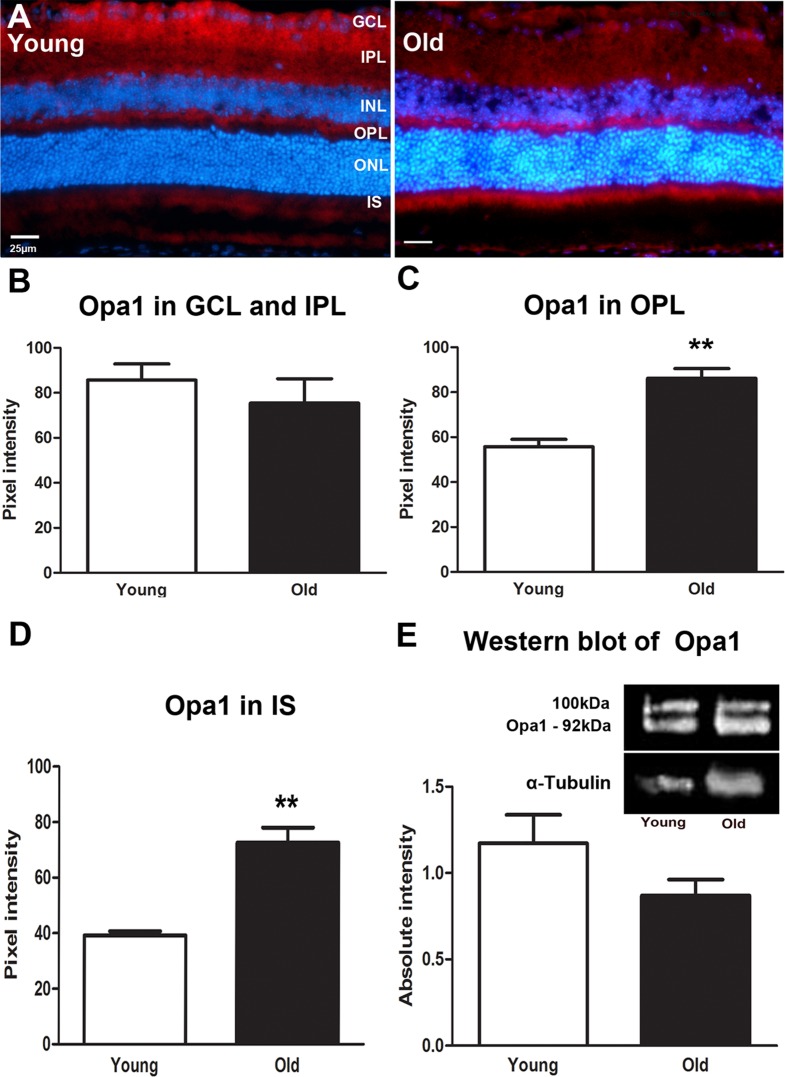
Figure 2. Changes in levels and distribution of mitochondrial fusion proteins in the ageing retina of C57BL/6 mice.
A. Representative micrographs of retinal sections immunostained with a fusion marker, Opa1 (red) and the nuclei counterstained with 4′, 6-diamino-2-phenylindole (DAPI) (Blue). Opa1 is present in the ganglion cell layer and in the outer plexiform layer of young mice while in the old it is present in the outer plexiform layer and the photoreceptor layer. B. Opa1 is expressed less in the old than the young retina. C. Opa1 expression is significantly higher in the outer plexiform layer of the old retina compared to the young (P = 0.0048). D. Opa1 expression in the photoreceptor layer. Opa1 is strongly expressed in the photoreceptor layer of the old retina when compared to the young (P = 0.0048). E. Western blot measurements of Opa1 protein revealing that it is reduced in the old retina compared to young but this did not reach statistical significance (P = 0.1276). Mean ± SEM. Scale bar = 25μm. GCL; ganglion cell layer, IPL; Inner plexiform layer, INL; inner nuclear layer, OPL; outer plexiform layer, ONL; outer nuclear layer, PR; photoreceptor layer and RPE; retinal pigment epithelial.

