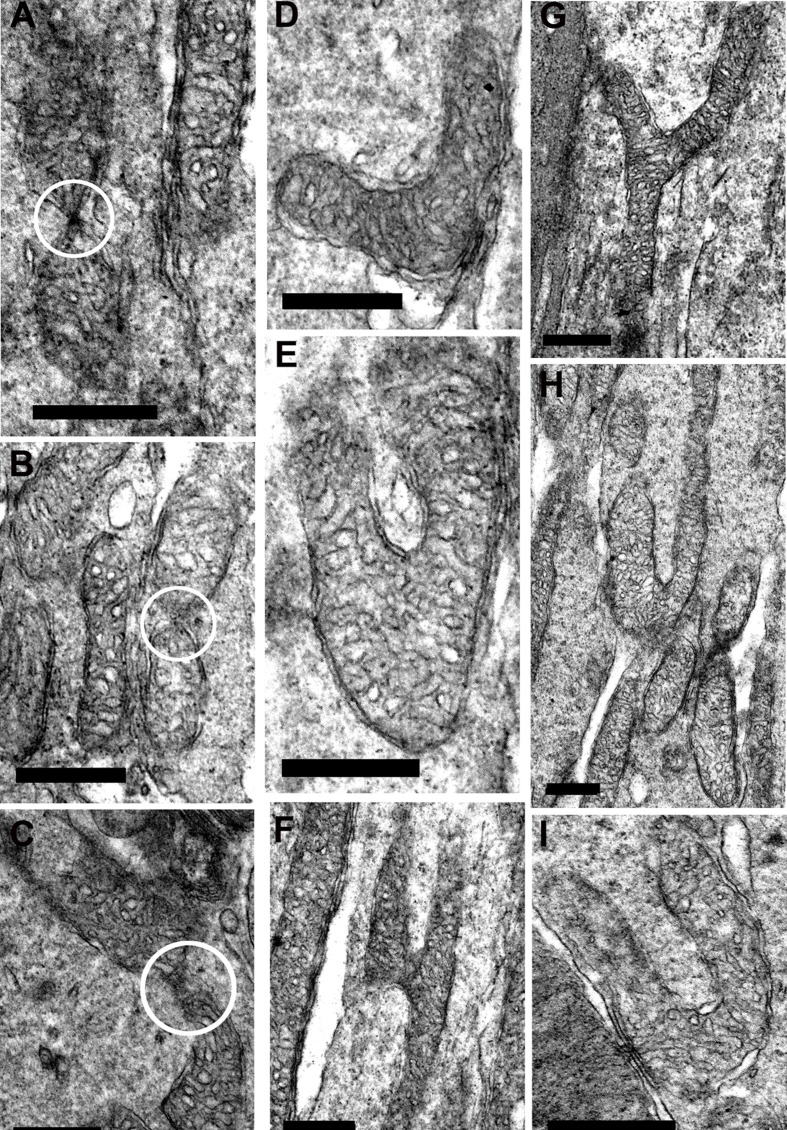
Figure 7. Fission and fusion in inner segment of young mice.
A.–C. are electron micrographs of mitochondria undergoing either fission or fusion (white circle) in the inner segment. D.–I. Representative electron micrographs of suspected mitochondrial fusion based on the criteria of Bereiter-Hahn and Voth [25] who showed using real time imaging that the branching in E and F resulted in fusion. The bends seen in D., E. H. and I. are associated with greater motility. Scale bar = 0.5 μm.

