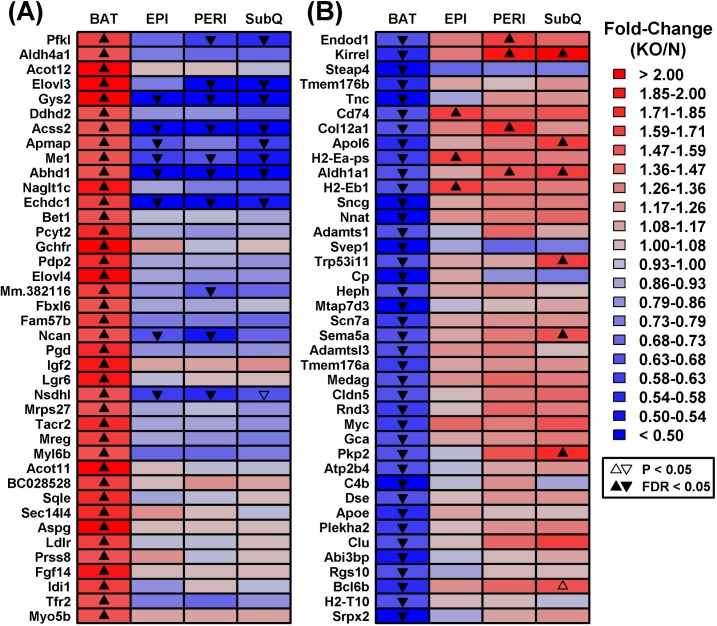
Figure 3. Genes with divergent gene expression changes in BAT versus WAT (GHRKO versus normal mice).
The 17,831 genes expressed in BAT and each WAT depot were filtered to identify those showing the most divergent gene expression changes in BAT as compared to WAT. A. DEGs increased in BAT and decreased/unaltered in WAT. GHRKO-increased genes (BAT) were filtered based upon the difference in fold-change estimated for BAT and the largest fold-change estimated for any WAT depot (log2 scale). B. DEGs decreased in BAT and increased/unaltered in WAT. GHRKO-decreased genes (BAT) were ranked based upon the difference in fold-change estimated for BAT and the largest fold-change estimated for any WAT (log2 scale). The 40 top-ranked genes with divergent expression shifts in BAT and WAT are shown in A. and B.

