
Figure 5. A subset of patients, of various cancer types, show low or reduced overall endogenous levels of CRT/CALR.
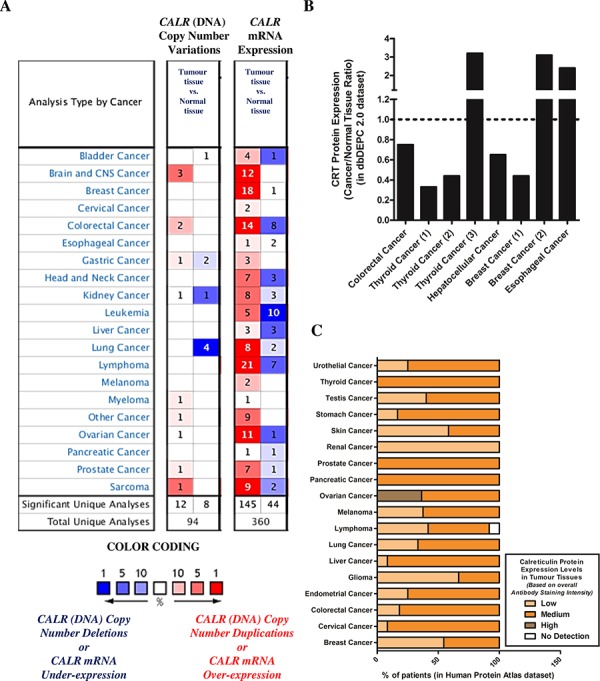
A. Differential CALR gene copy numbers or CALR mRNA levels between tissues derived from various cancer types and corresponding normal tissues were analysed using the Oncomine database (p-value threshold was set at less than 0.01; all fold changes were deemed valid). Over-expression or under-expression in the top 1, 5 and 10% are color-coded according to the legend. B. Ratio of differential CRT protein levels between tissues derived from various cancer types and corresponding normal tissues were analysed using the dbDEPC 2.0 proteomics database. C. Overall CRT protein levels determined in human tumour tissues via tissue microarray analysis-based immunohistochemistry were retrieved using the Human Protein Atlas database. Here, the level or overall intensity of antibody-based staining has been used to generate three annotated protein expression patterns i.e. high, medium, and low, and no detection levels (colour coded here, in the legend, where the intensity of colour indicates the level of expression/staining).