
Figure 7. Paclitaxel treated cancer patients with tumoural CALRlow phenotype, show cancer stage-independent poor clinical prognosis.
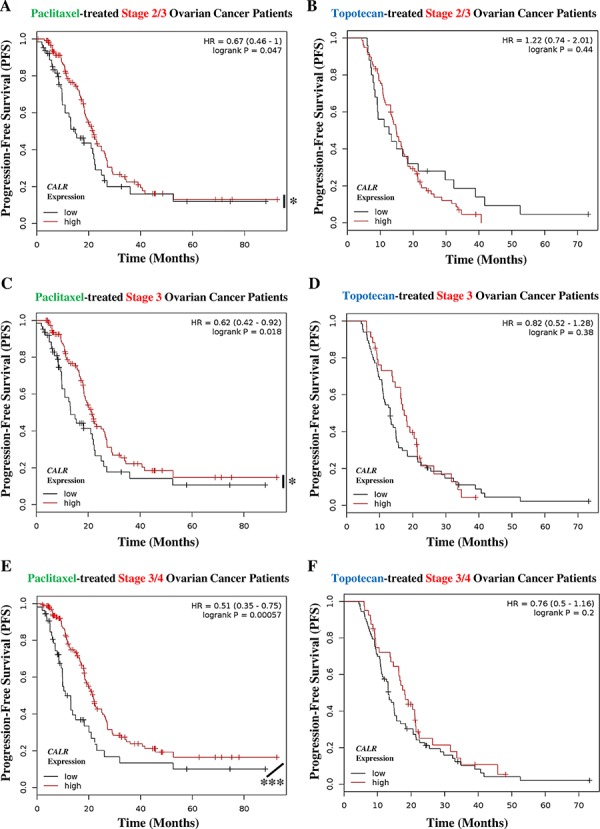
A, B. Stage 2/3 ovarian cancer patients treated with paclitaxel (n = 188) (A) or topotecan (n = 103) (B) were stratified into high (red lines) or low (black lines) expression-based “risk-groups” by considering the median of the overall transcript-expressions of CALR (paclitaxel – low n = 64, high n = 124; topotecan – low n = 25, high n = 78). This was followed by Kaplan-Meier plotting of the patient's progression-free survival (PFS) (Y-axis). C–D. Stage 3 ovarian cancer patients treated with paclitaxel (n = 177) (C) or topotecan (n = 100) (D) were stratified into high (red lines) or low (black lines) expression-based “risk-groups” by considering the median of the overall transcript-expressions of CALR (paclitaxel – low n = 62, high n = 115; topotecan – low n = 66, high n = 34). This was followed by Kaplan-Meier plotting of the patient's PFS (Y-axis). E–F. Stage 3/4 ovarian cancer patients treated with paclitaxel (n = 217) (E) or treated with topotecan (n = 113) (F) were stratified into high (red lines) or low (black lines) expression-based “risk-groups” by considering the median of the overall transcript-expressions of CALR (paclitaxel – low n = 54, high n = 163; topotecan – low n = 73, high n = 40). This was followed by Kaplan-Meier plotting of the patient's PFS (Y-axis). In all the above graphs, respective log-rank test p-values and hazard ratios (HR; with its 95% confidence interval in parenthesis) are displayed. Statistical significance (i.e. p < 0.05 or p < 0.0001) is indicated through an asterisk (* or ***).