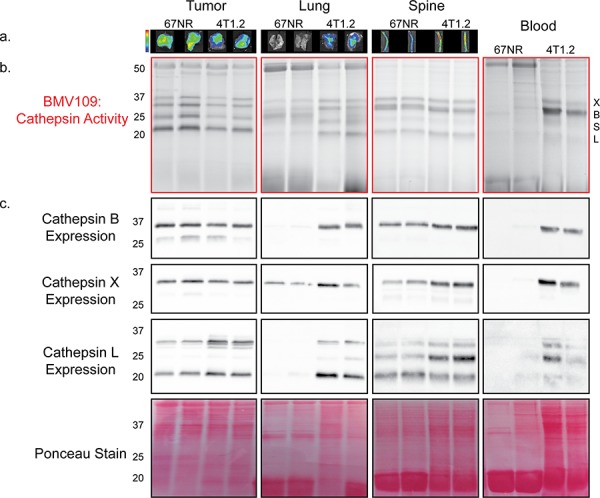
Figure 1. In vivo characterization of cysteine cathepsin levels in tissues from tumor-bearing mice.

a. Mice bearing 67NR or 4T1.2 primary tumors were injected with BMV109, and primary tumors, lungs and spines were imaged ex vivo for fluorescence due to cathepsin activity. Minimum and maximum values were set for each tissue type as follows [(p/sec/cm2/sr)/(μW/cm2)]: Tumor 4e8–1.4e9; Lung 3e8–9e8; Spine 2.7e8–9.2e8. b–c. Tissues in (a) as well as peripheral blood mononuclear cells were lysed and analyzed by SDS-PAGE. (b) BMV109 labeling indicates cathepsin activity (top panel) while (c) western blots with cathepsin-specific antibodies indicate expression (bottom panels). Darker bands indicate higher activity/expression. Two representative samples are shown for each tissue. Ponceau staining was used to ensure that equal protein was loaded.
