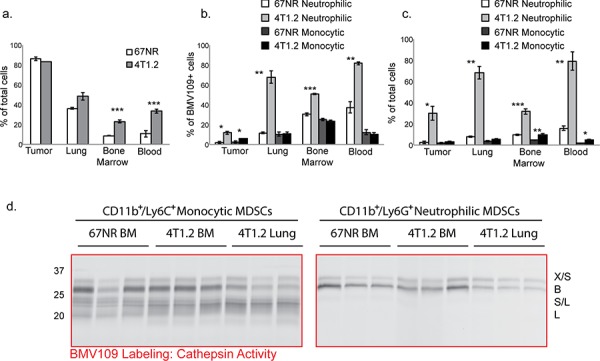
Figure 2. MDSCs produce active cysteine cathepsins.

BMV109-labeled tissues were dissociated into single cell suspensions and analyzed by flow cytometry. a. Comparisons of the percentages of BMV109+ cells in tissues from 67NR and 4T1.2 tumor-bearing mice. Error bars represent SEM. b. The percentage of the BMV109+ cells in (a) that were positive for CD11b and Ly6G (neutrophilic MDSC markers) or CD11b and Ly6C (monocytic MDSC markers). c. The percentage of all cells that are neutrophilic or monocytic MDSCs. For (a-c) asterisks indicate statistical significance between the percentage of 67NR and 4T1.2 cells within each subset. *p < 0.05, **p < 0.01, ***p < 0.001. d. Cathepsin activity in sorted neutrophilic and monocytic MDSCs from bone marrow and lungs of 67NR or 4T1.2 tumor-bearing mice. Darker bands indicate higher activity.
