
Figure 1. HBXIP regulates glucose metabolism reprogramming and downregulates SCO2 and PDHA1 in breast cancer.
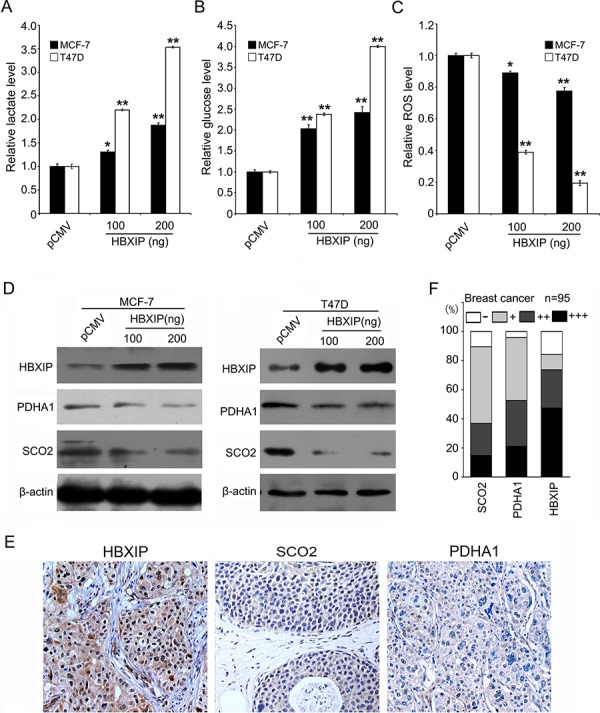
A. The levels of lactate in the culture media of MCF-7 and T47D cells were measured by an Agilent 1100 series high-performance liquid chromatography (HPLC) system and normalized to cell number. B. The levels of intracellular glucose were detected by glucose-lactate biosense tester SBA-40E and normalized based on the protein concentration in MCF-7 and T47D cells. C. The levels of intracellular ROS were assessed by flow cytometry analysis in MCF-7 and T47D cells. D. The protein levels of HBXIP, PDHA1 and SCO2 were examined by Western blot analysis in MCF-7 and T47D cells. E. The expression levels of SCO2, PDHA1 and HBXIP protein were examined by IHC analysis in clinical breast cancer tissues using tissue microarrays, which were from the same tissue paraffin block. F. The percentage of staining gradations of SCO2, PDHA1 and HBXIP of tissue microarrays containing 95 cases of clinical breast cancer tissues was shown. Statistically significant differences are indicated: *P < 0.05, **P < 0.01, Student's t-test. Each experiment was repeated at least three times. Data are shown as mean ± SEM (n = 3).