
Figure 3. HBXIP activates miR-183/96/182 promoter through transcriptional factor HIF1α.
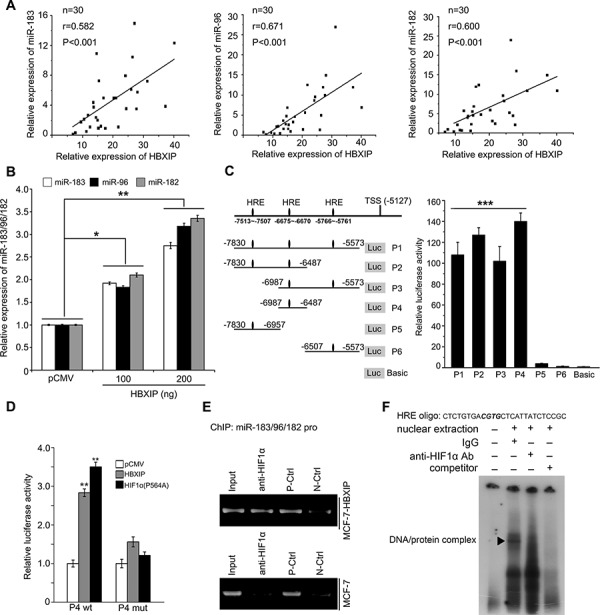
A. The correlations of HBXIP mRNA levels with miR-183 (miR-96 or miR-182) levels were detected by qRT-PCR analysis in 30 cases of clinical breast cancer tissues. B. The relative expression levels of miR-183, miR-96 and miR-182 were measured by qRT-PCR analysis in MCF-7 cells. C. Schematic diagram shows the miR-183/96/182 promoter with hypoxia response elements (HREs). The promoter activities of miR-183/96/182 cluster were determined by luciferase reporter gene assays in MCF-7 cells. D. The promoter activities of P4 (−6987~ −6487) of miR-183/96/182 were measured by luciferase reporter gene assays in MCF-7 cells. E. The interaction of HIF1α with the promoter region of miR-183/96/182 cluster was examined by ChIP assays in MCF-7 and MCF-7-HBXIP cells. F. The interaction of HIF1α with HRE located in the region of miR-183/96/182 promoter was examined by EMSA in MCF-7 cells. Statistically significant differences are indicated: *P < 0.05, **P < 0.01, Student's t-test. Each experiment was repeated at least three times. Data are shown as mean ± SEM (n = 3).