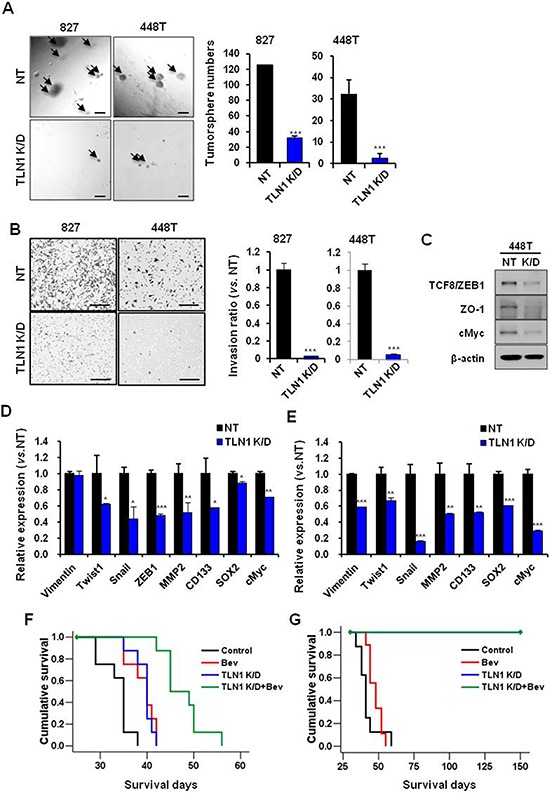
Figure 5. Effects of TLN1 inhibition on malignant progression and survival gains by bevacizumab in patient derived GBM cells.

A. Tumorsphere forming potentials of TLN1 K/D patient GBM cells were determined by matrigel sphere forming assay (Left). Bar represents 100 microns. The numbers of tumorsphere were counted (Right). Data are means ± SE. ***p < 0.001. B. Transwell invasion assays in NT or TLN1 K/D patient derived GBM cells were performed. Cells which were passed transwell were counted (Right) after H&E staining (Left). Bar represents 200 micron. Data are means ± SE. ***p < 0.001. C. Immumoblots of EMT and CSC proteins in TLN1 K/D patient derived GBM cells. D. and E. Expressions levels of EMT and CSC markers of GBM in NT or TLN1 K/D in patient derived GBM cells [827 (D) and 448T (E)] were determined by real-time RT-PCR analysis. Data are means ± SE (n = 3). *p < 0.05, **p < 0.01 and ***p < 0.001. F. and G. Kaplan-Meier survival curves of mice (n = 10 for each group) orthotopically implanted with NT or TLN1 K/D patient derived GBM [827 (F) and 448T (G)] and each groups were divided into two groups with bevacizumab treatment or not.
