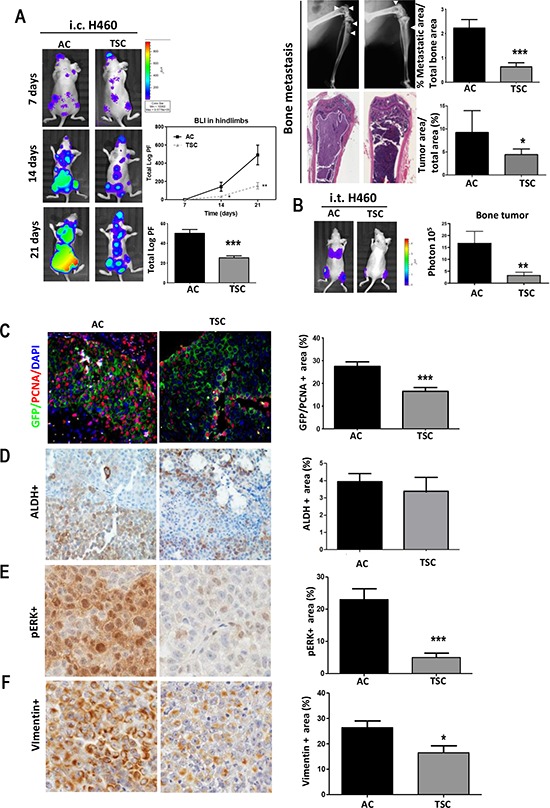
Figure 3. Decreased prometastatic activity of cells derived from TSC conditions.

A. Left panels: Representative images of BLI in mice after intracardiac inoculation (i.c.) of H460 AC or TSC cells in two groups athymic nude mice, demonstrating reduced bone metastasis formation in the hindlimbs and whole body. Quantification of total BLI (Photon flux: Log PF) in hind limbs (upper panel) and whole body (lower panel). Right panels: Representative images of X-Ray and H&E. Osteolytic area of the hind limbs (upper panel) and tumor area (lower panel) for each group are shown. White arrows point to the osteolytic lesions. Quantification of osteolytic area in X-ray images (upper panel) and tumor metastatic area (lower panel) are shown. B. Intratibial injection of H460 cells (TSC and AC cells) in two groups of athymic nude mice followed by BLI measurement and quantification demonstrated reduced osseous colonization in TSC-injected mice. C. Double immunofluorescence and quantification for tumor cells (GFP, green) and proliferative cells (PCNA, red) in bone metastasis after i.c. inoculation of H460 cells, showing lower proliferation in TSC-injected mice (at day 21). D. IHC and quantification of positive tumor area for ALDH, E. pERK and F. Vimentin. Error bars are mean ± SEM. *p, 0.05; **p < 0.01; ***, p < 0.001.
