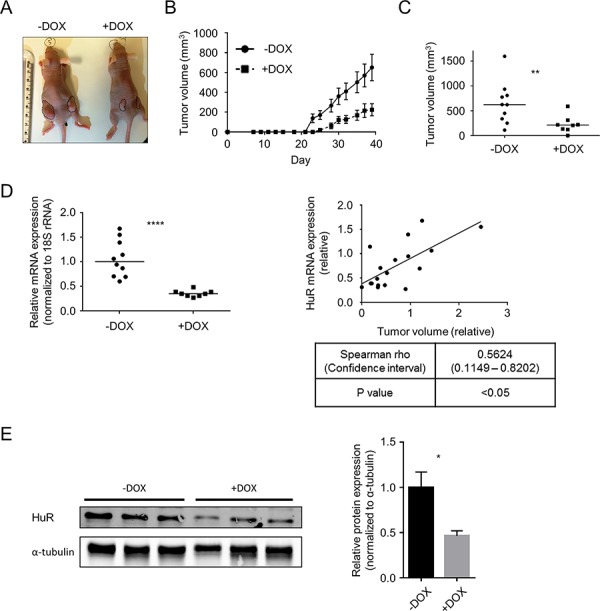
Figure 7. Induced HuR silencing suppresses PDA xenograft growth.

A. Representative images of subcutaneous Mia.sh290 tumors on the flanks of nude female mice, at the termination of the experiment (day 39). B. Tumor growth curves of Mia.sh290 xenografts. Mice were fed normal diet or 200 mg/kg DOX diet starting on day 0 (date of xenograft injection). Each data point represents the mean ± SEM (n = 10 for –DOX group, and n = 8 for +DOX group). C. Plot of all tumor volumes on the final day of the Mia.sh290 xenograft experiment (day 39). Horizontal bars represent the median tumor volumes. D. Left, qPCR analysis of HuR mRNA expression in all Mia.sh290 xenografts harvested on day 39. 18S rRNA was used as normalization control. Data were plotted relative to the mean HuR mRNA expression in the –DOX group. Horizontal bars represent the medians. Right, plot of HuR mRNA expression vs. tumor volume for all Mia.sh290 tumors. Data were plotted relative to the mean of the –DOX group. E. Left, representative western blot of HuR protein expression in Mia.sh290 tumors harvested on day 39. Alpha-tubulin was used as normalization control. Right, quantification of the western blot. Each bar represents the mean ± SEM (n = 3 per group). * = p < 0.05; ** = p < 0.01; **** = p < 0.0001.
