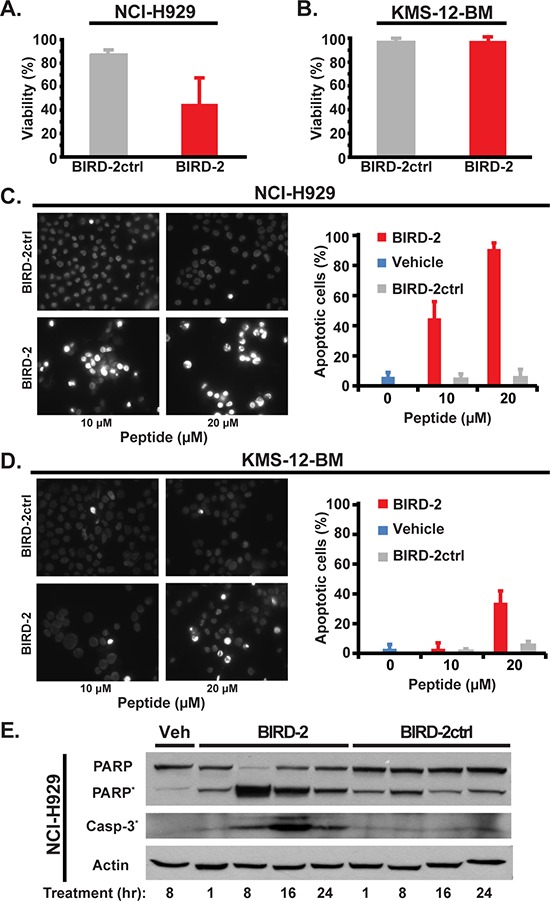
Figure 2. Apoptosis induction by BIRD-2.

A. and B. NCI-H929 (A) and KMS-12-BM (B) cell viability by MTS assay 24 hr after treatment with 10 μM BIRD-2 vs BIRD-2ctrl (mean ± SD of at least 3 experiments). C. and D. Left: representative epifluorescence images of Hoechst 33342-stained NCI-H929 (C) and KMS-12-BM (D) cells treated with 10 or 20 μM BIRD-2 or BIRD-2ctrl for 24 hr. Bright staining of nuclei is due to nuclear condensation and is characteristic of apoptosis, while dim staining indicates live cells. Right: quantification of apoptotic Hoechst 33342-stained nuclei. Data expressed as mean ± SD of over 200 cells per treatment group. E. Immunoblotting displaying relative levels of PARP, cleaved PARP*, and cleaved Caspase-3* in NCI-H929 cells treated with either vehicle (Veh) water, 10 μM BIRD-2 or BIRD-2ctrl for the indicated times. Beta actin is loading control.
