
Figure 5. High expression of the myeloproliferative leukemia virus oncogene (MPL) in AML patients and MPL sustained malignant proliferation.
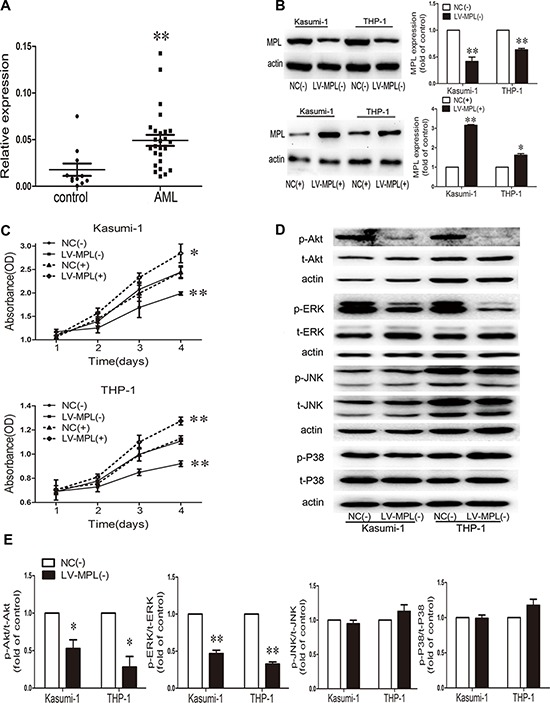
A. qRT-PCR analysis of MPL mRNA level in bone marrow from AML patients (n = 27) and controls (n = 11). Each point represents one sample. Horizontal bars represent the means, the whiskers represent SEM. **P < 0.01, AML vs. control. B. Western blot analysis and quantification of MPL protein expression by lentiviral infection in Kasumi-1 and THP-1 cells. NC(−), negative control of MPL knockdown; LV-MPL(−), MPL knockdown; NC(+), negative control of MPL overexpression; LV-MPL(+), MPL overexpression. *P < 0.05 and **P < 0.01, LV-MPL vs. NC. C. Cell viability of Kasumi-1 and THP-1 cells with MPL knockdown or overexpression. *P < 0.05 and **P < 0.01, LV-MPL vs. NC. D. Western blot analysis and E. quantification of p-Akt, t-Akt, p-ERK, t-ERK, p-JNK, t-JNK, p-P38, and t-P38 protein expression with MPL knockdown in Kasumi-1 and THP-1 cells. *P < 0.05, **P < 0.01, LV-MPL vs. NC. Data represent the mean ± SEM.