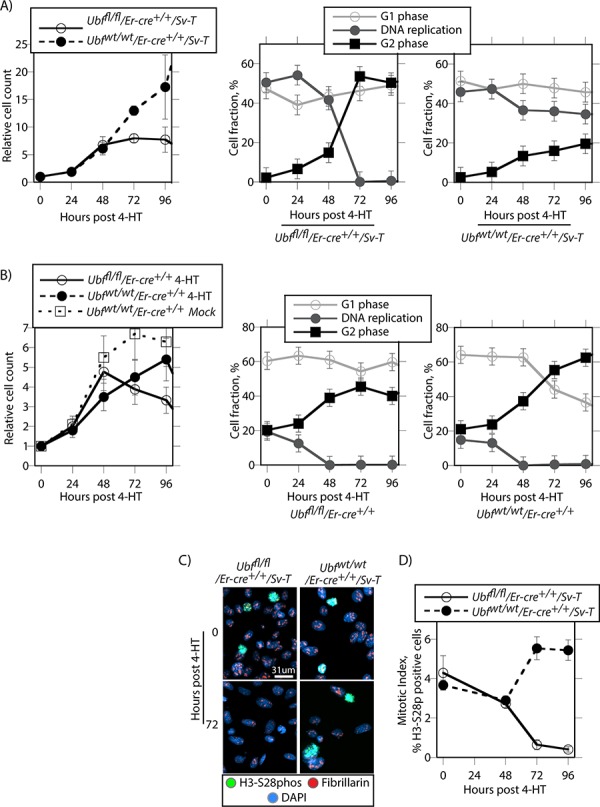
Figure 5. UBF loss arrests cell proliferation and leads to a cell cycle arrest.

A. Ubffl/fl/Er-cre+/+/Sv-T and Ubfwt/wt/Er-cre+/+/Sv-T iMEFs and B. the corresponding primary MEFs were analyzed for proliferation and cell cycle distribution at the indicated times post 4-HT treatment. The left-most graphics give cell counts relative to day 0 and include those for Ubfwt/wt/Er-cre+/+ MEFs cultured in the absence of 4-HT (Mock), while to the right of these are shown the cell cycle distributions obtained from FACS analyses for active DNA replication (Click-iT® EdU) and G1 and G2 DNA content (propidium iodide, PI). C. shows examples of mitotic staining, and D. a derived graphic of the mitotic index for the Ubffl/fl/Er-cre+/+/Sv-T and Ubfwt/wt/Er-cre+/+/Sv-T iMEFs as determined by the fraction of H3-S28phospho positive cells. In A to D, Ubf recombination and UBF protein levels were assayed in parallel and closely followed those shown in Figure S2B and S2C.
