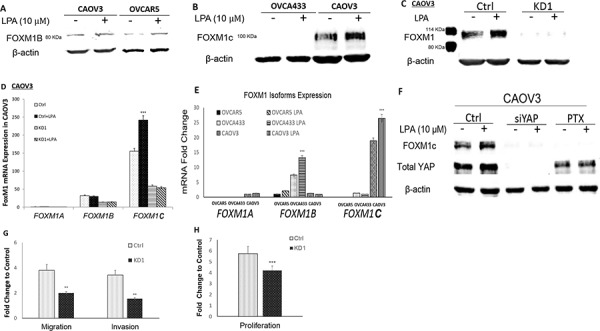
Figure 5. LPA-induced FOXM1 in other EOC cell lines and FOXM1C was the dominant form in CAOV3 cells.

A. LPA (10 μM and 6 hr) induced FOXM1 up-regulation in CAOV3 and OVCAR5 cells. CAOV3 and OVCAR5 cells expressed the FOXM1B with apparent MW of 80 KDa (Sigma, Cat. Log # AV39518). B. OVCA433 cells did not express FOXM1C, while CAOV3 cells expressed the FOXM1C with apparent MW of 100 KDa (Cell Signaling, Cat. Log # D12D5). C. CAOV3-FOXM1-KD cell line was established using shRNA against FOXM1 (detailed in Methods). The parental or control-shRNA transfected CAOV3 cells responded to LPA (10 μM, 6 hr) for FOXM1 up-regulation, which was blocked by KD-FOXM1. D. The dominant splicing form of FOXM1 in CAOV3 was FOXM1C. E. Comparison of the relative mRNA expression levels FOXM1 isoform in three EOC cell lines. F. KD-YAP and PTX inhibited LPA-induced FOXM1 up-regulation in CAOV3 cells. G. KD-FOXM1 inhibited LPA-induced cell migration and invasion. H. KD-FOXM1 inhibited FBS (2%)-induced cell proliferation. *P < 0.05; **P < 0.01; and ***P < 0.001.
