
Figure 2. Clonal analyses using mutational abundance microsatellite-unstable genomes.
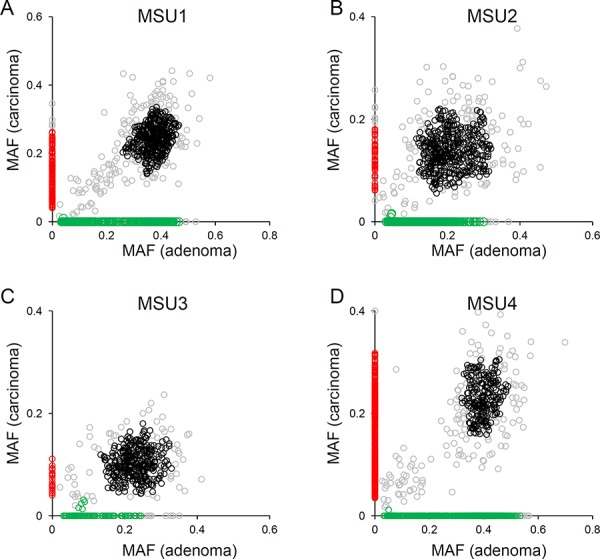
A. The distribution of MAF in adenoma (x-axis) and carcinoma (y-axis) is illustrated for MSU1. Four mutation clusters are distinguished with respective clones (black, clonal; green, adenoma-specific; red, carcinoma-specific). The mutations that do not belong to these three classes are shown in gray. B–D. Similar representations are shown for the other three MSU cases.