
Figure 3. Abundance of somatic mutations.
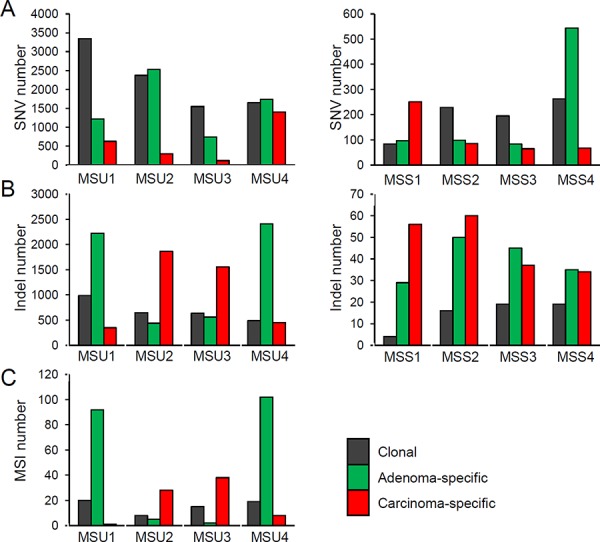
A. The SNV abundance is shown for three regional classes (clonal as well as adenoma- and carcinoma-specific mutations, in the indicated colors). Four MSU and four MSS cases are shown in the left and right panels, respectively. B. The indel abundance is shown similarly. C. The MSI abundance is shown for four MSU cases.