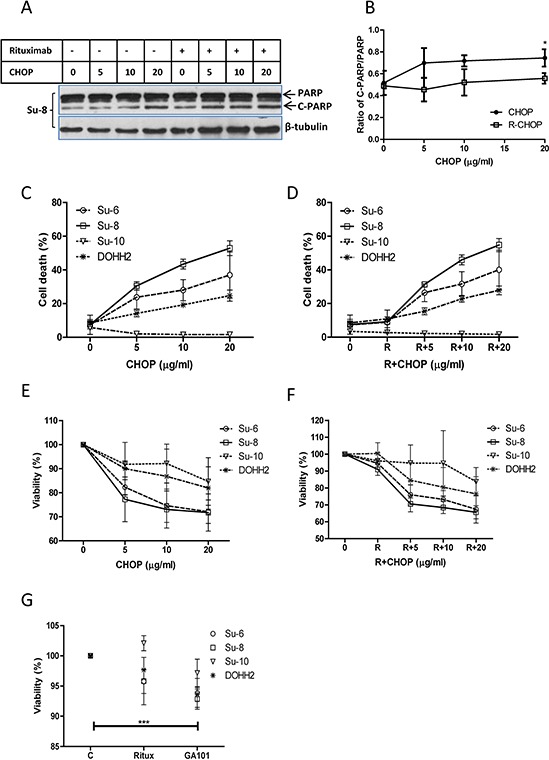
Figure 1. Comparison of CHOP and R-CHOP-induced killing in DLBCL cell lines.

DLBCL cell lines were treated with 5, 10, or 20 μg/ml of CHOP, 10 μg/ml of rituximab, or R-CHOP for 24 hours. A. PARP cleavage. A group of representative Western blots of PARP cleavage induced by CHOP or R-CHOP. ‘PARP’ means full length PARP (MW = 116) and ‘C-PARP’ indicates cleaved PARP (MW = 86). β-tubulin was used as a loading control. B. Statistical analysis of PARP cleavage. Ratios of cleaved PARP to PARP were analyzed by densitometry. Data shown were mean ± SD from 4 different cell lines. ‘*’ means significantly increased PARP cleavage in 20 μg/ml CHOP-treated groups compared with their controls. C and D. CHOP (C) or R-CHOP (D) induced cell death. Cells were stained with 7-AAD and 7-AAD positive cells were determined by flow cytometry as dead cells. E and F. CHOP (E) or R-CHOP (F) –mediated cytotoxicity. After treatment with CHOP or R-CHOP for 48 hours, decreased viability (cytotoxicity) was determined by CCK-8 assay. G. Rituximab or GA-101-induced cytotoxicity. Cells were treated with 10 μg/ml rituximab (Ritux) or GA-101 for 48 hours and the cytotoxicity was determined by CCK-8 assay. Significantly increased cytotoxicity in GA-101-treated group was analyzed using means from 4 different cell lines. (C–F) Data shown were mean ± SD from 3 independent experiments.
