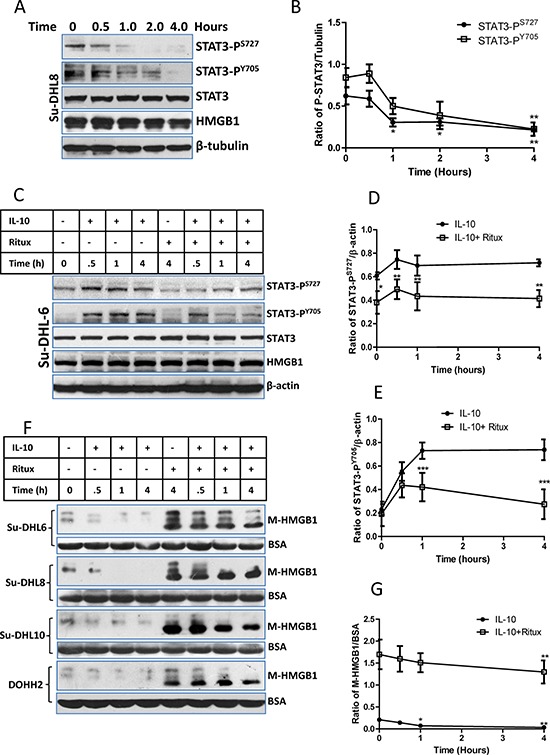
Figure 4. Correlation between STAT3 inhibition and HMGB1 release.

A and B. Rituximab-induced a time-dependent inhibition on STAT3 activity. (A) A group of representative Western blots and other groups of Western blots were presented in the Supplemental Figure 4A; (B) Statistical analysis of rituximab induced STAT3 inhibition. Data shown were mean ± SD of STAT3/β-tubulin from 4 different cell lines. Rituximab-induced significantly decreased STAT3 activities were compared with their controls using two-way ANOVA analysis. C, D and E. rituximab-induced STAT3 inhibition on IL-10 treated cells. DLBCL cells were treated with 10 ng/ml of IL10 and/or 10 μg/ml of rituximab simultaneously. (C) A group of representative Western blots and other groups of Western blots were presented in the Supplemental Figure 4B; (D and E) Statistical analysis of rituximab-induced inhibition on STAT3-PS727 and (D) STAT3-PY705 (E) Data shown were mean ± SD from four different cell lines. Rituximab-induced significant inhibition of STAT3 activities on IL-10-treated cells were compared with those treated with IL-10 alone using two-way ANOVA analysis. F and G. Effects of IL-10 and rituximab on HMGB1 release. After cells were treated with IL-10 and/or rituximab, the conditioned medium was used for Western blotting. (F) Western blotting detection of HMGB1 in the conditioned medium (M-HMGB1). BSA was used as a loading control. (G) Statistical analysis of IL-10 and/or rituximab on HMGB1 release. Data shown were mean ± SD of M-HMGB1/BSA from four DLBCL cell lines. IL-10 significantly inhibited HMGB1 release was compared with the control.
