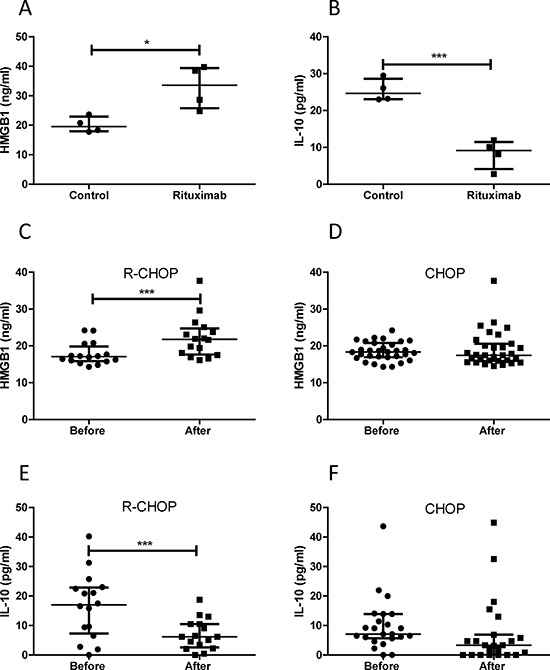
Figure 6. Quantitative analysis of HMGB1 and IL-10 levels.

A and B. Rituximab induced HMGB1 release and inhibition on IL-10 production in DLBCL cell lines. Four DLBCL cell lines in 2 × 10⁶/ml concentration were treated with rituximab for 4 hours. 10 μl of conditioned medium was used to measure concentrations of HMGB1 (A) and IL-10 (B) C and D. HMGB1 plasma concentrations before and after treatment with R-CHOP (C) or CHOP (D) E and F. IL-10 plasma concentrations before and after treatment with R-CHOP (E) or CHOP (F) Data shown are median ± interquartile range. Two pairs of extreme data, HMGB1 (from 135.38 to 25.67 ng/ml) and IL-10 (from 432.45 to 458.97 pg/ml) before and after treatment with CHOP were removed from (D) and (F), respectively, for presentation purpose.
