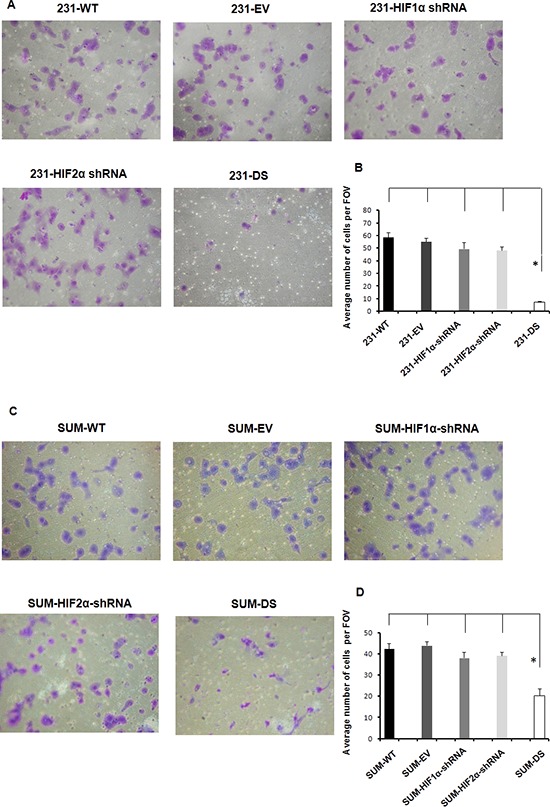
Figure 4.

A. Representative images shown at 10X and B. quantitation of MDA-MB-231 sublines that invaded through a matrigel coated transwell chamber (*p < 0.05). C. Representative images shown at 10X and D. quantitation of SUM149 sublines that invaded through a matrigel coated transwell chamber (*p < 0.05). Values represent Mean ± SE with n = 4 for each group.
