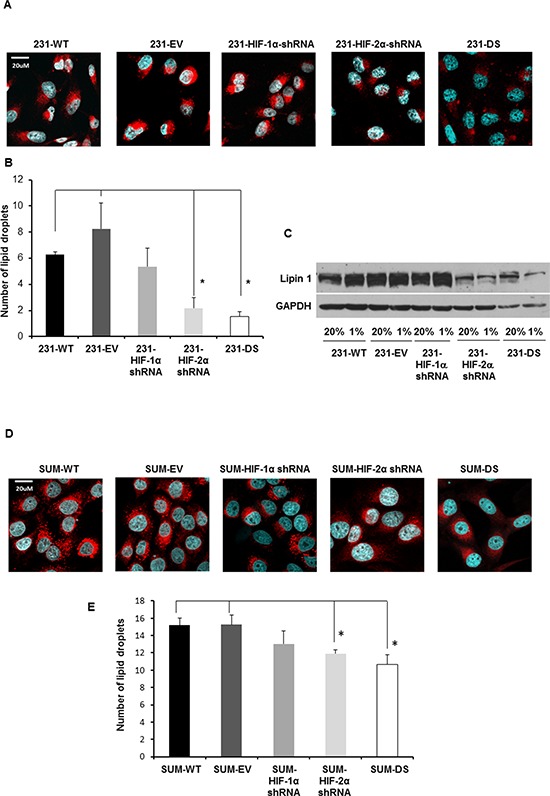
Figure 8.

A. Representative confocal images acquired at 40X with lipid droplets visualized by Nile Red staining (red) and nuclei by DAPI staining (blue) in MDA-MB-231 sublines. B. Quantification of lipid droplets in MDA-MB-231 sublines (*p < 0.05). C. Immunoblot showing Lipin 1 expression under normoxia and hypoxia in MDA-MB-231 sublines. D. Representative confocal images acquired at 40X with lipid droplets visualized by Nile Red staining (red) and nuclei visualized by DAPI staining (blue) in SUM149 sublines. E. Quantification of lipid droplets in SUM149 sublines (*p < 0.05). Approximately 20–40 cells per FOV from six different fields of view were analyzed for each n value. Values represent Mean ± SE, n = 4.
