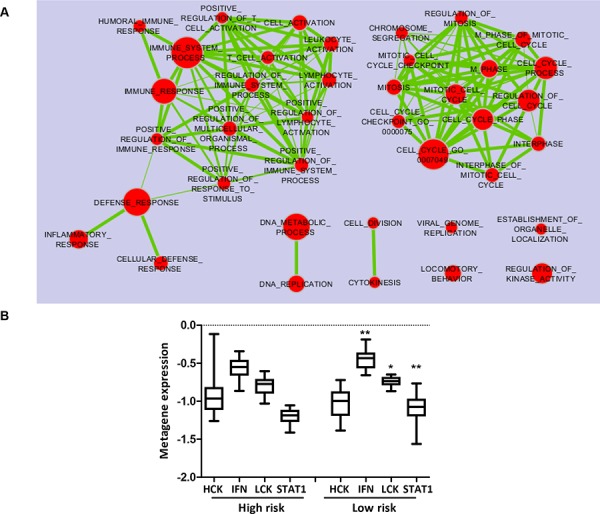
Figure 4. Immune metagene expression according to TRAR classification.

A. Enrichment Map of pathways (Gene Ontology Biological Processes) significantly enriched (p < 0.005, FDR <0.1) in TRAR-low compared to TRAR-high tumors by GSEA analysis. B. Association between immune metagene expression (HCK: hematopoietic cell kinase, IFN: interferon, LCK: lymphocyte-specific kinase metagenes) and TRAR subtypes. p-values by one-way ANOVA (*p = 0.023–0.025, **p = 0.0034).
