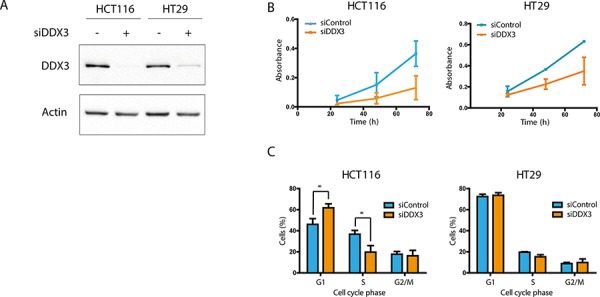
Figure 1. DDX3 dependency in colorectal cancer cell lines.

A. Immunoblots of DDX3 expression in colorectal cancer cell lines HCT116 and HT29 before and after inhibition of DDX3 with 50 nM siDDX3. B. Proliferation of Colorectal cancer cell lines after knockdown of DDX3, measured by daily MTS assays. C. Cell cycle analysis after knockdown of DDX3. All experiments were performed three independent times, graphs represent mean ± SD, *p < 0.05
